Download
1 / 62
620 likes | 630 Vues
Cost and Revenue Allocations. EMBA 5412 Fall 2010. Introduction. We will emphasize the allocation of costs to divisions, plants, departments, and contracts; also address the common cost allocation the joint cost allocations; and the revenue allocations. Why allocate Cost?.

E N D
Cost and Revenue Allocations EMBA 5412 Fall 2010
Introduction • We will • emphasize the allocation of costs to divisions, plants, departments, and contracts; • also address • the common cost allocation • the joint cost allocations; • and • the revenue allocations
Why allocate Cost? • We allocate indirect costs that can not be easily traced to products, services, etc. • Why do managers allocate indirect costs to these cost objects?
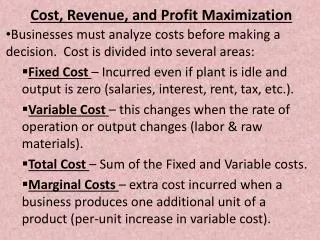
Purposes of Cost Allocation • To provide information for economic decisions • To motivate managers and other employees • To justify costs or compute reimbursement • To measure income and assets for reporting to external parties
Criteria • Cause-and-effect:identify the variable or variables that cause resources to be consumed • Allocation based on this relation would be the most acceptable by the departments/managers
Criteria • Benefits-received:managers identify the beneficiaries of the outputs of the cost object • The costs of the cost object are allocated among the beneficiaries in proportion to the benefits each receives • Have to convince the managers of departments
Criteria • Fairness or equity:This criterion is often cited on government contracts when cost allocations are the basis for establishing a price satisfactory to the government and its suppliers. • Cost allocation is viewed as a “reasonable” or “fair” means of establishing a selling price in the minds of the contracting parties.
Criteria • Ability to bear:This criterion advocates allocating costs in proportion to the cost object’s ability to bear them. • An example is the allocation of corporate executive salaries on the basis of division operating income.
Cost-Benefit Approach • Companies place great importance on the cost-benefit approach when designing and implementing their cost-allocation system. • The costs of designing and implementing a system are highly visible. • The benefits from using a well-designed system are difficult to measure and are frequently less visible.
Allocating Costs of a Supporting Department to Operating Departments • Supporting (Service) Department – provides the services that assist other internal departments in the company • Operating (Production) Department – directly adds value to a product or service
Methods to Allocate Support Department Costs • Single-Rate Method – allocates costs in each cost pool (service department) to cost objects (production departments) using the same rate per unit of a single allocation base • No distinction is made between fixed and variable costs in this method
Methods to Allocate Support Department Costs • Dual-Rate Method – segregates costs within each cost pool into two segments: a variable-cost pool and a fixed-cost pool. • Each pool uses a different cost-allocation base
Allocation Method Tradeoffs • Single-rate method is simple to implement, but treats fixed costs in a manner similar to variable costs • Dual-rate method treats fixed and variable costs more realistically, but is more complex to implement
Allocation Bases • Under either method, allocation of support costs can be based on one of the three following scenarios: • Budgeted overhead rate and budgeted hours • Budgeted overhead rate and actual hours • Actual overhead rate and actual hours • Choosing between actual and budgeted rates: budgeted is known at the beginning of the period, while actual will not be known with certainty until the end of the period
Methods of Allocating Support Costs to Production Departments • Direct • Step-Down • Reciprocal
Direct Method • Allocates support costs only to Operating Departments • No interaction between Support Departments prior to allocation
Service Allocation: Direct Method • Procedure: • Ignore each service department’s use of other service departments. • Allocate service department costs only to operating departments. • Advantages: • Simple to administer and explain. • Disadvantages: • Allocations are not accurate estimates of opportunity costs when service departments use other service departments. • Incentives exist for service departments to make excessive use of other service departments.
Step-Down Method • Allocates support costs to other support departments and to operating departments that partially recognizes the mutual services provided among all support departments • One-way interaction between Support Departments prior to allocation
Service Allocation: Step-down Method • Procedure: • Start with one service department and allocate all of its costs to the remaining service and operating departments. • Continue one-by-one through each service department allocating all • direct costs of that department and costs allocated to it. • A good way of choosing the order of allocation is by (1) most reliable “cause and effect” cost driver, (2) number of other departments serviced, and (3) finally, as the default, total budget of department. • Advantages: • Considers some of the interdependence of service departments • Disadvantages: • Resulting allocations are inaccurate estimates of opportunity costs. • Allocation less than opportunity cost for first department • Allocation more than opportunity cost for last department
Reciprocal Method • Allocates support department costs to operating departments by fully recognizing the mutual services provided among all support departments • Full two-way interaction between Support Departments prior to allocation
Service Allocation: Reciprocal Method • Procedure: • Write equations defining variable cost relationships among divisions. • Solve system of simultaneous equations with linear algebra. • Allocate fixed costs based on each operating division’s planned use of the service department’s capacity. • Advantages: • Most accurate method (best approximates opportunity costs) • Disadvantages: • Slightly harder to set up and compute solution • Difficult to explain results to unsophisticated managers • Prevents managers from “managing” cost allocations for financial reporting and/or taxes.
Choosing Between Methods • Reciprocal is the most precise • Direct and Step-Down are simple to compute and understand • Direct Method is widely used
Step-down method • Two service depts; • We can start with either one but would yield different results • Usually start with the service dept that provides a higher percentage of service to other service departments first • Rank the service departments in the order that they provide service to other service departments
Service Department Cost Allocation assuming separate fixed and variable costs Example • Dual rates are used • Distributed in class
Allocating Common Costs • Common Cost – the cost of operating a facility, activity, or like cost object that is shared by two or more users at a lower cost than the individual cost of the activity to each user
Methods of Allocating Common Costs • Stand-Alone Cost-Allocation Method – uses information pertaining to each user of a cost object as a separate entity to determine the cost-allocation weights • Individual costs are added together and allocation percentages are calculated from the whole, and applied to the common cost
Example – Common costs • The manager of your plants in Russia wanted to consult you and wanted you to visit their sites.Below are the possible fares for these trips individually or combined. You will charge the cost of your plane ticket to these two sites. • Dubna and St.Petersburg • Ankara-Dubna-Ankara costs TL 800 • Ankara-St.Peterburg-Ankara costs TL 1300 • Ankara-Dubna-St.Peterburg-Ankara costs TL 1900 • How would you allocate the cost between these two sites?
Example common costs – stand alone Determine weights: Dubna = St.Peterburg = Then costs are Dubna 38.1% *1900= 723.90 St.Peterburg 69.1% *1900 =1176.10
Methods of Allocating Common Costs • Incremental Cost-Allocation Method ranks the individual users of a cost object in the order of users most responsible for a common cost and then uses this ranking to allocate the cost among the users • The first ranked user is the Primary User and is allocated costs up to the costs of the primary user as a stand-alone user (typically gets the highest allocation of the common costs) • The second ranked user is the First Incremental User and is allocated the additional cost that arises from two users rather than one • Subsequent users handled in the same manner as the second ranked user
Example common cost • Assuming Dubna plant is the first user • Dubna gets 800 TL; St.Peterburg gets 1900 – 800 = 1100 TL • Assuming St.Peterburg is the first • St.Peterburg gets 1300 TL; Dubna gets 1900 – 1300 = 600 TL Probably have to agree with the management.
Cost Allocations and Government Contracting • two main ways: • The contractor is paid a set price without analysis of actual contract cost data • The contractor is paid after an analysis of actual contract cost data. In some cases, the contract will state that the reimbursement amount is based on actual allowable costs plus a fixed fee (cost-plus contract)
Death Spiral • Death spiral occurs when large fixed costs of a common resource are allocated to users who could decline to use that resource. As the allocated costs increase, some users choose to decrease use. Then the fixed costs are allocated to the remaining users, more of whom use less. This process repeats until no users are willing to pay the fixed costs. • Possible solutions to death spiral: • When excess capacity exists, charge users only for variable costs. • Reduce the total amount of fixed costs allocated.
Death Spiral Example: Cost-based Contracts Defense contractors working on advanced technology incur large fixed cost over-runs that are allocated to each aircraft manufactured. • Government reduces number of aircraft purchased and that causes average cost to increase on remaining orders. • Government responds by ordering even fewer aircraft. • Eventually, the entire project is abandoned before all fixed costs are recovered.
Joint cost allocation • Joint cost is incurred to produce two or more outputs from the same input. • Joint costs occur only in disassembly processes, such as refining and food processing. • Common costs occur in either disassembly or assembly processes, such as building cars
Joint Costs: Process Further? • Split-off point: the point in the disassembly processing at which all joint costs have been incurred • Decision: Should each joint product be processed further or sold as is at the split-off point? • Solution concept: The joint costs are sunk costs at the split-off point. Do the incremental benefits of further processing exceed the incremental costs?
Joint Costs: Net Realizable Value • Net realizable value (NRV) is the difference between selling price and costs that would be incurred after the split-off point. • Compute NRV of each product after the split-off point. Decide to produce products with positive NRV, but not with negative NRV. • For control and divisional reporting, allocate joint costs to products in the ratio of the NRV of each product.
Yogurt Split off point Process further Raw MILK Pasteurize MILK White Cheese Sell as MILK Joint costs- example
Joint costs example • In June 2008, Bizim Sut processes 220,000 lt of raw milk. During processing until the split off point 10,000 lt are lost due to evaporation, spillage,etc. • After the split off point, the may be processed further to yogurt or cheese that share a second common processing which costs 200.000 TL . • Price of milk: 1.50 TL per lt • Price of Yogurt 3.50 TL per kg; further processing cost 0.60 TL per kg • Price of cheese 7 TL per kg further processing cost 2 TL per kg • Joint cost of processing raw milk 100.000 TL • The company decides to sell half of pasteurized milk as is; and process the rest yielding 75,000 kg yogurt and 25,000 cheese losing 5,000 lt more during the process.