Download
1 / 41
430 likes | 670 Vues
Business cost and revenue. Chapter 6. Business cost and revenue. This unit will explain: Why businesses need to know the costs of running their activities and revenue gained by selling their products The different types of cost involved in running a business

E N D
Business cost and revenue Chapter 6
Business cost and revenue This unit will explain: • Why businesses need to know the costs of running their activities and revenue gained by selling their products • The different types of cost involved in running a business • How break-even analysis helps managers make decisions • The purpose of budgets and financial forecasts
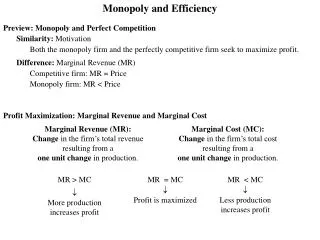
Business cost and revenue Business costs • All business activity involves some kind of cost. Managers need to think about the because:Whether costs are lower than revenues or not. Whether a business will make a profit or not. • To compare costs at different locations. • To help set prices.
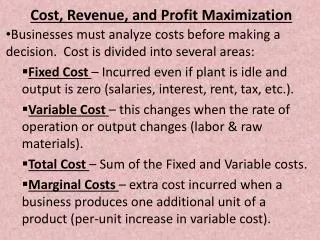
Business cost and revenue There are two main types of costs, fixed and variable costs. Fixed costs = stay the same regardless of the amount of output. They are there regardless of whether a business has made a profit or not. Common examples of fixed costs include rents, salaries of permanent employees and buildings.
Business cost and revenue • Variable costs = varies with the amount of goods produced. They can be classified as direct costs (directly related to a product). • Variable costs may include wages, utilities, materials used in production, etc.
Business cost and revenue • Thetotal cost is the amount of money spent by a firm on producing a given level of output. Total costs are made up of fixed costs (FC) and variable costs (VC). Total cost
Business cost and revenue • Total costs = fixed + variable costs • The variable costs cause the total costs curve to be upward sloping. The greater the output the higher he costs. • If there was an increase in a fixed cost, would the total cost line • (a) Shift upwards in a parallel direction(b) Shift downwards in a parallel direction(c) Pivot upwards(d) Pivot downwards
Business cost and revenue • IGCSE Business Studies p89 Activity 6.1
Business cost and revenue • Break-even charts, comparing costs with revenue • Break-even charts are graphs which show how costs and revenues of a business change with sales
Business cost and revenue Break-even charts, comparing costs with revenue • Uses of break-even charts • There are other benefits from the break-even chart other than identifying the breakeven point and the maximum profit. However, they are not all reliable so there are some disadvantages as well:
Business cost and revenue • Pros:The expected profit or loss can be calculated at any level of output. • The impacts of business decisions can be seen by redrawing the graph. • The breakeven chart show the safety margin which is the amount by which sales exceed the breakeven point.
Business cost and revenue • Cons:The graph assumes that all goods produced are sold. • Fixed costs will change if the scale of production is changed. • Only focuses on the breakeven point. Completely ignores other aspects of production. • Does not take into account discounts or increased wages, etc. and other things that vary with time.
Business cost and revenue • IGCSE Business Studies p89 Activity 6.2, 6.3
Business cost and revenue • Break-even point: the calculation method.It is possible to calculate the breakeven point without having to draw the graph. We need two formulas to achieve this: • Selling Price - Variable Costs = Contribution • Break-even point =
Business cost and revenue • Business costs: other definitionsThere are other types of costs to be analyzed that is split from fixed and variable costs: • Direct costs: costs that are directly related to the production of a particular product. • Marginal costs: how much costs will increase when a business decides to produce one more unit.
Business cost and revenue • Indirect costs: costs not directly related to the product. They are often termed overheads. • Average cost per unit: • If the cost of producing computer A was $350,000 and 700 units were made. • Avg cost/unit =
Business cost and revenue Economies scale: Economies of scale are factors that lead to a reduction in average costs that are obtained by growth of a business. There are five economies of scale:
Business cost and revenue Economies scale • Purchasing economies: Larger capital means you get discounts when buying bulk. • Marketing: More money for advertising and own transportation, cutting costs.
Business cost and revenue Economies scale • Financial: Easier to borrow money from banks with lower interest rates. • Managerial: Larger businesses can now afford specialized managers in all departments increasing efficiency. • Technical: They can now buy specialized and buy the latest equipment to cut overall production costs.
Business cost and revenue Diseconomies of scale • However, there are diseconomies of scale which increases average costs when a business grows: • Poor communication: It is more difficult to communicate in larger firms since there are so many people a message has to pass through. The managers might lose contact with customers and make wrong decisions.
Business cost and revenue Diseconomies of scale • Low morale: People work in large businesses with thousands of workers do not get much attention. They feel they are not needed this decreases morale and in turn efficiency. • Slower decision making: More people have to agree with a decision and communication difficulties also make decision making slower as well.
Business cost and revenue • P95 activity 6.4 • P96 activity 6.5
Budget and forecasts: looking ahead • All business should plan for the future. • failure to plan for future could result in a miss opportunity or threat. • Managers may attempt to predict: • Sales or consumer demand • Exchange rates of the currency • Wage increases. Budget and forecasts: looking ahead
Budget and forecasts: looking ahead • These predictions are called FORECASTS. • Forecasts try to reduce uncertainty of future events.
Budget and forecasts: looking ahead • Forecasting methods: • Past sales could be used to calculate the trend, which could then be extended into the future. • Create a line of best fit for past sales and extend it for the future. Definitions: A TREND is an underlying movement or direction of data over time. Definition: LINE OF BEST FIT A line drawn through a series of points, for example, sales data, which best shows the trend of that data. It can be used to forecast results in the future
Budget and forecasts: looking ahead Line of best fit Forecast
Budget and forecasts: looking ahead • Panel consensus: asking a panel of experts for their opinion on what is going to happen in the future. • Market research.
Budget and forecasts: looking ahead • Costs and Benefits of Forecasting: Benefits: • Aids decision making • Informs planning and resource allocation decisions • If data is of high quality, can be accurate
Budget and forecasts: looking ahead Costs: • Data not always reliable or accurate • Data may be out of date • The past is not always a guide to the future • Qualitative data may be influenced by peer pressure • Difficulty of coping with changes to external factors out of the business’s control – e.g. economic policy, political developments (9/11?), natural disasters – hurricanes, earthquakes, etc.
Budget and forecasts: looking ahead • Budgets: • Budgets are plans for the future containing numerical of financial targets • Well managed businesses will set budgets for revenue, costs, production levels, raw materials required, labor, and cash flow. • Master budget shows the planned revenue, costs and profit or loss for the business over a given period of time.
Budget and forecasts: looking ahead • The advantages of budgets: • They set objectives for managers and workers to work towards, increasing their motivation. • They can be used to see how well a business is doing by comparing the budget with the actual results. This process is calledvariance analysis. The varianceis the difference between the budget and the result.
Budget and forecasts: looking ahead • The advantages of budgets: • The setting of the budgets can involve all workers and supervisors as well as managers. Participation can lead to greater motivation and more accurate budget. • Helps control the business and its allocation of resources/money
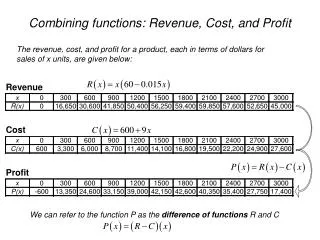
Case study task a) Calculate the x and y variances
Case study task • Budget – actual = variance Variance X = 4,000 – 5,000 Variance X = (1,000) Variance Y = 32,700 – 37,300 Variance Y = (4,600)
Case study task b) Should the manager be satisfied with the cost levels of this firm? No, the manager shouldn’t be satisfied. The firm is over budget, shown by the negative variance. Greater cost control is needed Possible reasons – unrealistic budget. - Unexpected cost or events
Case study task c) If the manager wanted to reduce cost to the budgeted levels, which costs do you think he should focus on? Those with negative variance. Start with the greatest negative variance and move your way down.
You should be able to: • Distinguish between fixed costs and variable costs • Understand what the break-even level of output means • Use break-even charts to find the break-even level of output and draw simple break-even charts • Understand the main causes of economies and diseconomies of scale • Explain the purposes of budgets and analyse simple examples • Explain the purposes of forecasts i.e sales forecasts