Download
1 / 9
90 likes | 241 Vues
Peter Carlson. Hydrologic Responses to Draught in the Barton Creek Segment of the Edwards Aquifer. Edwards Aquifer. Includes contributing, recharge, and artesian zones Provides drinking water for 2 million people. Barton Springs Segment .

E N D
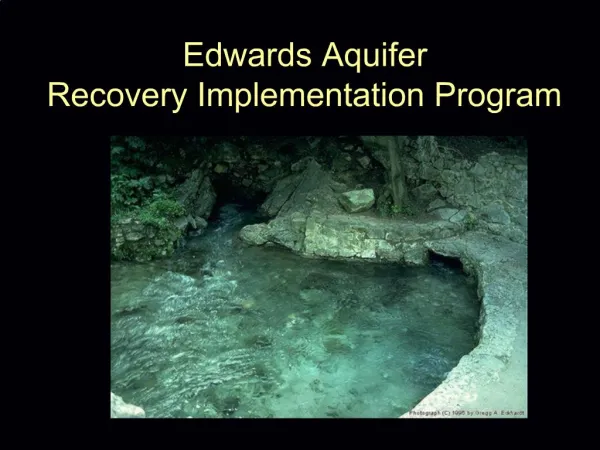
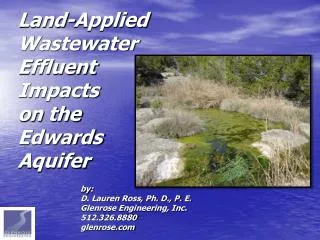
Peter Carlson Hydrologic Responses to Draught in the Barton Creek Segment of the Edwards Aquifer
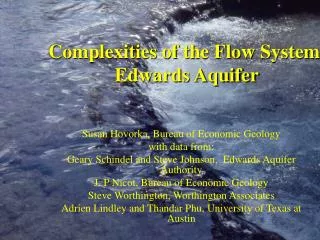
Edwards Aquifer Includes contributing, recharge, and artesian zones Provides drinking water for 2 million people.
Barton Springs Segment South of Austin: highly visible segment of the Edwards Aquifer.
Watersheds for Stream Gages Generated watersheds using NED30 data and with the zones of the aquifer. Downloaded NLADS data from NOAH.
Python Problems Could not perform zonal averaging reliably.
1/8 degree grid intersections Intersected the watersheds and aquifer zones with a 1/8° grid corresponding with the NLADS data. Area weighting coefficients for zonal averaging. Python program to interpret *.asc files without using ArcMap.
Palmer Draught Severity Index PDSI uses temperature and precipitation to estimate soil water supply and demand.
Gage Flow vsPrecipition:Separated by PDSI • Low correlations between precipitation and gage flow may be due to poor accounting for storm events in precipitation data. • Higher correlation between gage flow and precipitation suggest that some buffer diminishes the effects of storms on gage flow.
Conclusions • In draught conditions, the recharge zone and the contributing zone respond similarly to precipitation events. • In non-draught conditions, flow through the contributing zone does not reflect calculated precipitation.