Download
1 / 45
450 likes | 456 Vues
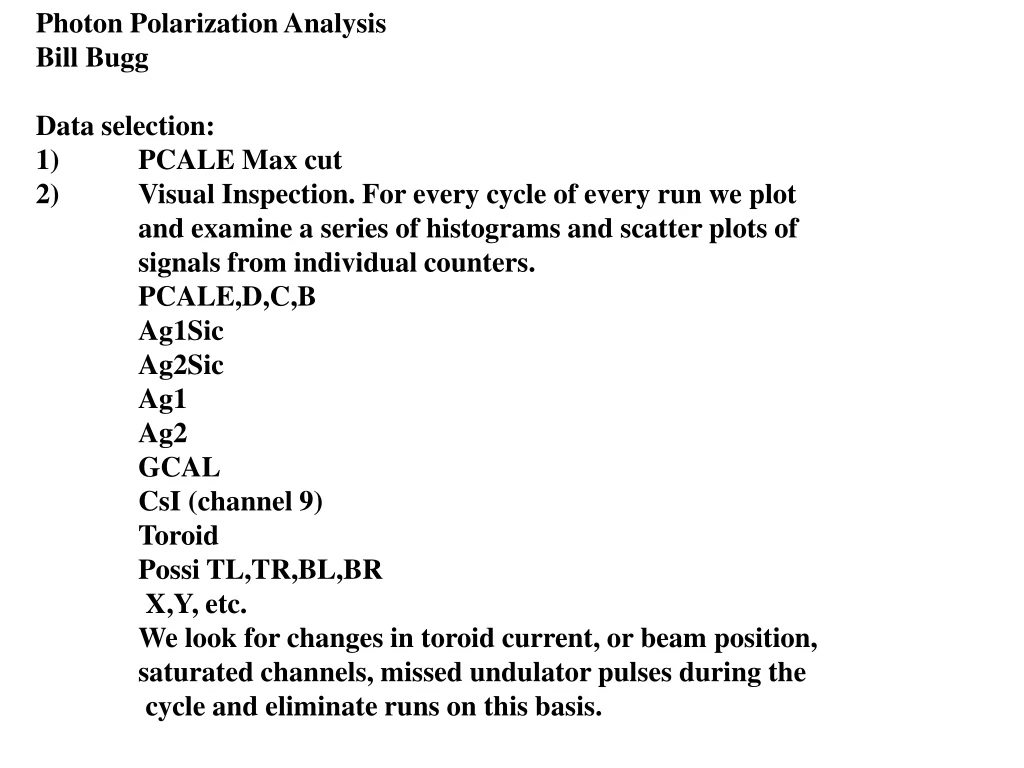
Photon Polarization Analysis Bill Bugg Data selection: 1) PCALE Max cut 2) Visual Inspection. For every cycle of every run we plot and examine a series of histograms and scatter plots of signals from individual counters. PCALE,D,C,B Ag1Sic Ag2Sic Ag1 Ag2 GCAL CsI (channel 9)

E N D
Photon Polarization Analysis Bill Bugg Data selection: 1) PCALE Max cut 2) Visual Inspection. For every cycle of every run we plot and examine a series of histograms and scatter plots of signals from individual counters. PCALE,D,C,B Ag1Sic Ag2Sic Ag1 Ag2 GCAL CsI (channel 9) Toroid Possi TL,TR,BL,BR X,Y, etc. We look for changes in toroid current, or beam position, saturated channels, missed undulator pulses during the cycle and eliminate runs on this basis.
Adjacent runs with opposite field are treated in pairs and • averaged to obtain the global asymmetry. • To more closely monitor the results I divide the data into • segments of approximately 20-30 pairs(60 run cycles) which • are examined separately and then combined. • For now I chose not to remove ‘flyers’(results outside 3 sigma) • unless study of data for the cycles involved identifies a problem • missed earlier.
ANALYSIS In routine analysis background is subtracted and counter data normalized to AG1SiC signal. (Ag1 works about as well) Signal ratios and the difference/sum value evaluated for each pair. For each segment the average value and standard deviation is recorded and a plot of diff/sum vs run pair number made.This is done for the transmitted photon signal measured by Ag2SiC, Ag2 and GCAL For target in data we evaluate asymmetries for CsI channel 9 (crystal 5) and two signals Possisum and AG1which should show no asymmetry. The weighted mean and error of the segment results are then calculatedfor the entire sample. A few selection examples follow.
Run 2542 target in Good
Run 2590 cycle 1 Target out (Bad)
For target out data analysis has been completed for the selected runs from the June and September runs(about 200 runs). In addition target in results are obtained for superrun data(lens=340, spectrometer=140,about 450 runs) taken with 0.25X0 target. (Runs 2542-2631), A small amount of June data is also included. Measurement of the transmitted photon asymmetry is made by 3 separate counters, Ag2Sic, AG2, and GCAL. Ag1Sic counts all photons with approximately equal sensitivity, Ag2 threshold is about 4.5MeV and GCAL signal is proportional to transmitted energy. For target in data we also report the CsI (channel 9) asymmetry and in addition test for asymmetry in the AG1 and PossiSum signal both of which should be small. The latter is a test for asymmetry due to possible effect of analyzing magnet fringe field on the positrons striking the reconversion target.
This was the result that made us wonder if fringe field of Analyzing magnet was affecting CsI asymmetry. Possold had a definite asymmetry which was of opposite sign to CsI asymmetry.