Download
1 / 1
30 likes | 160 Vues
D-band. D‘-band. G-band. w ph. w ph. 2w ph. M. Breusing, N. Severin, S. Eilers, J. Rabe and T. Elsässer. Ultrafast Carrier Dynamics in Graphene. after t D …. abs. Conclusion. Pump-Probe Spectroscopy. information about carrier distribution with10fs time resolution

E N D
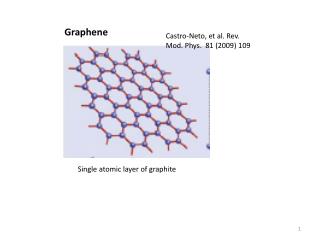
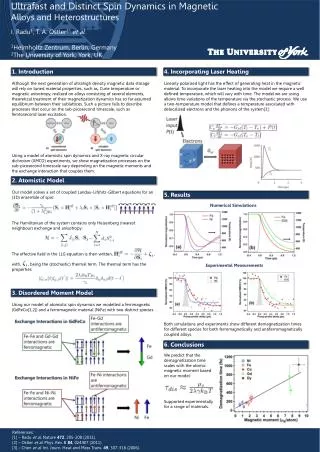
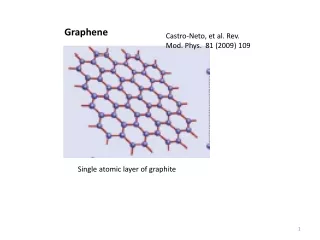
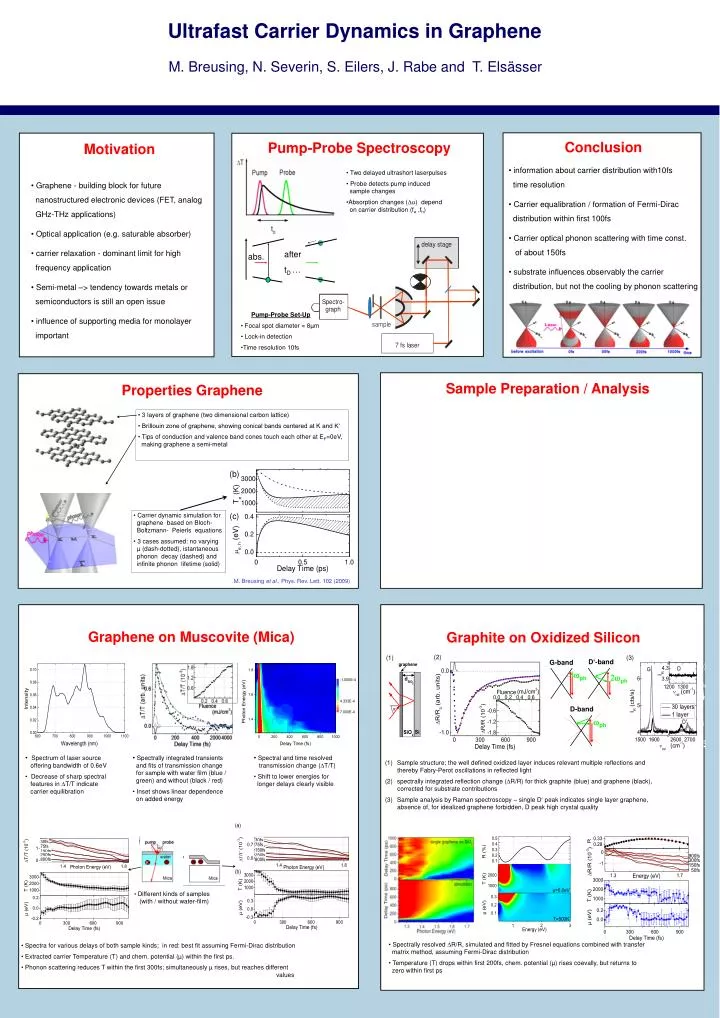
D-band D‘-band G-band wph wph 2wph M. Breusing, N. Severin, S. Eilers, J. Rabe and T. Elsässer Ultrafast Carrier Dynamics in Graphene after tD … abs. Conclusion Pump-Probe Spectroscopy • information about carrier distribution with10fs • time resolution • Carrier equalibration / formation of Fermi-Dirac • distribution within first 100fs • Carrier optical phonon scattering with time const. • of about 150fs • substrate influences observably the carrier • distribution, but not the cooling by phonon scattering • Two delayed ultrashort laserpulses • Probe detects pump induced • sample changes • Absorption changes (Da) depend • on carrier distribution (fe ,fh) Motivation • Graphene - building block for future • nanostructured electronic devices (FET, analog • GHz-THz applications) • Optical application (e.g. saturable absorber) • carrier relaxation - dominant limit for high • frequency application • Semi-metal –> tendency towards metals or • semiconductors is still an open issue • influence of supporting media for monolayer • important • Pump-Probe Set-Up • Focal spot diameter 8µm • Lock-in detection • Time resolution 10fs Sample Preparation / Analysis Properties Graphene Graphite on Oxidized Silicon • 3 layers of graphene (two dimensional carbon lattice) • Brillouin zone of graphene, showing conical bands centered at K and K‘ • Tips of conduction and valence band cones touch each other at EF=0eV, • making graphene a semi-metal (2) (1) (3) • Sample structure; the well definedoxidizedlayerinduces relevant multiple reflectionsand • thereby Fabry-Perot oscillations in reflectedlight • spectrallyintegratedreflectionchange (DR/R) forthickgraphite (blue) andgraphene (black), • correctedforsubstratecontributions • Sample analysisby Raman spectroscopy – single D‘ peakindicatessinglelayergraphene, • absenceof, foridealizedgrapheneforbidden, D peakhighcrystalquality • Carrier dynamic simulation for • graphene based on Bloch- • Boltzmann- Peierls equations • 3 cases assumed: no varying • µ (dash-dotted), istantaneous • phonon decay (dashed) and • infinite phonon lifetime (solid) M. Breusing et al., Phys. Rev. Lett. 102 (2009) Graphene on Muscovite (Mica) • Spectrally resolved DR/R, simulated and fitted by Fresnel equations combined with transfer • matrix method, assuming Fermi-Dirac distribution • Temperature (T) drops within first 200fs, chem. potential (µ) rises coevally, but returns to • zero within first ps • Spectrum of laser source • offering bandwidth of 0.6eV • Decrease of sharp spectral • features in DT/T indicate • carrier equilibration • Spectrally integrated transients • and fits of transmission change • for sample with water film (blue / • green) and without (black / red) • Inset shows linear dependence • on added energy • Spectral and time resolved • transmission change (DT/T) • Shift to lower energies for • longer delays clearly visible • Different kinds of samples • (with / without water-film) • Spectra for various delays of both sample kinds; in red: best fit assuming Fermi-Dirac distribution • Extracted carrier Temperature (T) and chem. potential (µ) within the first ps. • Phonon scattering reduces T within the first 300fs; simultaneously µ rises, but reaches different • values