Download
1 / 39
440 likes | 657 Vues
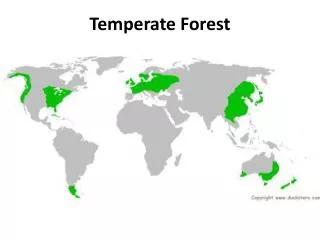
CO 2 exchange and water balance of a mature temperate forest. Adrian Walcroft Landcare Research Palmerston North NEW ZEALAND. Introduction. Native forests occupy 23% NZ land area Growth rates are generally low C sequestration rates uncertain (+0.3 to –2.5 Mt C y -1 )

E N D
CO2 exchange and water balance of a mature temperate forest Adrian Walcroft Landcare Research Palmerston North NEW ZEALAND
Introduction • Native forests occupy 23% NZ land area • Growth rates are generally low • C sequestration rates uncertain (+0.3 to –2.5 Mt C y-1) • Mature forests store large amounts of C • 940 Mt C in forest biomass (Hall et al. 2001) • ~1400 Mt C in forest soils (Tate et al. 1997) • Environment is changing • Increasing temperature (esp. night), cloudiness, [CO2] • Effects on C sequestration and storage unknown, but potentially large • Understanding processes important
Lowland podocarp-broadleaved forests comprise 21% of native forest area • Data on physiological properties of major species are scarce (rimu, kamahi) • how will the forests respond to environmental change? • will they be a carbon sink or source in the future? Objective • Measure and model carbon and water fluxes for a mixed conifer-broadleaved ecosystem • Develop a robust, process-based model of Net Ecosystem CO2 Exchange • Test and validate models using independent data • Quantify annual carbon and water balance
Project outline • Site description and climate data • Provide parameter values for the model • Vcmax, Jmax, Rleaf, Leaf area index, Rsoil • Provide independent data to validate the model • Net Ecosystem Exchange • Tree transpiration • canopy model description & validation • annual CO2 exchange and water balance • model uncertainty: LAI • ecosystem sensitivity: temperature, cloudiness, ambient CO2 concentration • conclusions measurement focus modelling focus
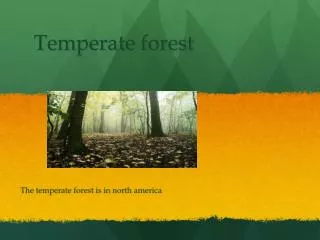
Okarito forest site • Weathered glacial outwash • 3.4 m rainfall y-1, leached, acidic, nutrient poor soils • shallow aerobic zone, deep organic layer • Mean annual temperature 11.3ºC
Okarito forest • Lowland terrace forest, rimu dominant canopy • Most trees 150-200 y old, a few 400 y old • regeneration following earthquake • Low fertility, especially P (foliage 1.2% N, 0.05% P) • Very low productivity
1. Measurements – site & climate • Site characteristics • species abundance and mapping (50 m x 50 m plot) • stem height & diameter, crown volume • leaf area index, vertical and horizontal distribution • Climate data • meteorological station on the tower • half hourly recording • solar radiation (direct and diffuse) • air temperature & humidity • wind speed & direction • rainfall • soil water content
Okarito forest – species composition • Rimu dominant canopy with Kamahi/Quintinia understorey
2. Parameters • Photosynthesis • leaf-level photosynthetic capacity • scaling (leaf to canopy): canopy N distribution • forest floor (bryophyte layer) • Respiration • leaf, stem and soil respiration • scaling (leaf-canopy; stem-canopy; forest floor) • environmental regulation • Water balance • Stomatal conductance: transpiration • Forest floor evaporation
Cc biochemistry mesophyll Ci stomata Ca boundary layer Leaf-level photosynthesis • A/Ci measurements in a chamber under controlled conditions • Rimu - very low apparent photosynthetic capacity – low mesophyll conductance
Scaling photosynthesis • small gradients in leaf nitrogen content Tissue et al. (2003) Tree Physiology25: 447-456
Scaling photosynthesis • little spatial variation in photosynthetic capacity Tissue et al. (2003) Tree Physiology25: 447-456
Forest Floor Photosynthesis • Measured CO2 exchange using chambers • Bryophyte photosynthesis responded to irradiance • Spatial variation related to bryophyte microcosm DeLucia et al. (2003) Global Change Biology 9:1158-1170.
Soil respiration • measured using chambers on soil (less bryophytes) • soil respiration strongly regulated by temperature • periodically influenced by water table
Stem respiration • measured using chambers on stems • respiration rate regulated by stem temperature • variation between stems Bowman et al. (1993) New Phytologist 167: 815-828.
Stomatal conductance • Measured under ambient conditions - variability • Strongly regulated by air saturation deficit (D) • Quantify parameters for Leuning model
Forest floor evaporation • Regulated by available energy – solar radiation reaching the ground DeLucia et al. (2003) Global Change Biology 9:1158-1170.
wind direction 3. Validation measurements CO2 • measure daily Net Ecosystem Exchange (NEE) • eddy covariance – integrates over large area
Tree canopy transpiration 3. Validation measurements • measure sap flux using heat pulse method
4. Model description • Leaf-level mechanistic models • photosynthesis (Farquhar et al) • stomatal conductance (Leuning) • transpiration, leaf temperature (Penman-Monteith eqn) • Scaling up to the canopy • radiative transfer model – multi-layered canopy, separate sun and shade leaves, direct and diffuse radiation • Multiple canopy components • distribution of photosynthetic capacity (leaf N) • Respiration by foliage, stems and soil • temperature responses • scale-up by respiring surface area (wood surfaces, forest floor) • Linked to a daily soil water balance • stomatal conductance reduced at low soil water content D soil water content = rainfall - evaporation - transpiration – drainage
Direct + Diffuse Irradiance Diffuse Irradiance Photosynthesis Photosynthesis Transpiration Transpiration n components
Model validation – sap flux • Model slightly overestimates canopy transpiration • Rimu comprise only 75% of canopy volume • Wet canopy evaporation poorly modelled
Model validation • model simulated CO2 flux poorly!!
Problem was night-time respiration van Gorsel, E., Leuning, R., Cleugh, H.A., Keith, H., Kirschbaum M.U.F., Suni, T., 2008. Application of an alternative method to derive reliable estimates of nighttime respiration from eddy covariance measurements in moderately complex topography. Agricultural and Forest Meteorology 148:1174-1180
Model validation • Reanalysed night-time eddy data
Daily forest CO2 exchange • photosynthesis regulated by irradiance • respiration regulated by temperature • net flux peaks in November, then declines • forest is a C source for most of the year
Annual ecosystem carbon balanceMg C ha-1 y-1 photosynthesis • Net CO2 exchange is a small difference between two large fluxes • Mature indigenous temperate rainforest is a net carbon source foliagerespiration 15.2 6.6 woodrespiration 3.5 soil and forest floor respiration netecosystemC loss-5.1 forest floorphotosynthesis 12.4 2.2
forest floor evaporation 170 (5) drainage 2180 (68) Annual ecosystem water balancemm (% of rainfall) rainfall transpiration 3210 226 (7) Wet canopyevaporation 644 (20) • Rainfall and drainage dominate the water balance • Tree transpiration only a small component of forest water balance
Model uncertainty • model has many parameters with uncertain values • leads to uncertainty in predicted outputs • quantify uncertainty due to LAI
Ecosystem sensitivity • process-based model can be used to explore sensitivity to a changing environment • cloudiness, night temperature, atmospheric CO2 concentration
Conclusions • Photosynthesis by trees and respiration by soil and foliage dominate the net ecosystem CO2 exchange • Canopy CO2 uptake is very low, consistent with slow tree growth • nutrient limitation, leaf internal resistance • Ecosystem model predicted NEE well • Don’t always believe eddy data!! • Have faith in your model!! • Ecosystem respiration exceeds CO2 uptake • Ecosystem is presently a net source for CO2 • Predicted outputs are uncertain • Net CO2 exchange is sensitive to environmental changes • Rate of CO2 release may increase
Landcare Research David Whitehead, Graeme Hall, Margaret Barbour, John Hunt,Fiona Carswell, Tony McSeveny, Graeme Rogers, Frank Kelliher, Jackie Townsend, Des Ross, Craig Trotter University of Canterbury Matthew Turnbull, David Norton Columbia University, Texas Tech University, Ohio University,Black Rock Forest Consortium, University of Illinois Kevin Griffin, David Tissue, Vic Engel, Kim Brown, Will Bowen,Bill Schuster, Evan DeLucia Timberlands West Coast Ltd. and Department of Conservation Ian James Foundation for Research, Science & TechnologyAndrew W Mellon Foundation