Download
1 / 60
600 likes | 709 Vues
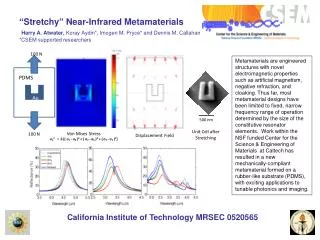
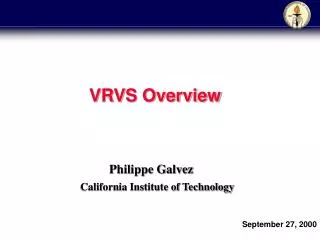
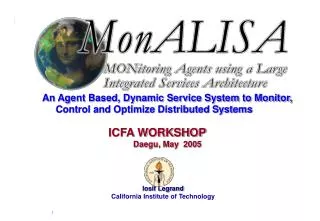
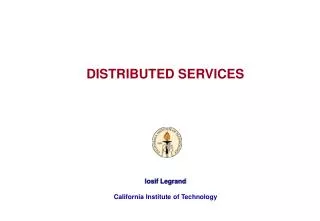
Monitoring, Control and Optimization in Large Distributed Systems. ECSAC- August 2009, Veli Losink. Iosif Legrand California Institute of Technology. Monitoring Distributed Systems.

E N D
Monitoring, Control and Optimization in Large Distributed Systems ECSAC- August 2009, Veli Losink Iosif Legrand California Institute of Technology
Monitoring Distributed Systems An essential part of managing large scale, distributed data processing facilities, is a monitoring system that is able to monitor computing facilities, storage systems, networks and a very large number of applications running on these systems in near-real time. The monitoring information gathered for all the subsystems is essential for design, debugging, accounting and the development of “higher level services”, that provide decision support and some degree of automated decisions and for maintaining and optimizing workflow in large scale distributed systems.
Monitoring Information is necessary for System Design, Control, Optimization, Debugging and Accounting ACCOUNTING Computing Models Modeling & Simulations Optimization Algorithms MONITORING ~ REAL Information Create resilient Distributed Systems Control and Operational support ALARMS DEBUGGING
The LHC Data Grid HierarchyThe need for distributed computing (MONARC) Tier2 Center Tier2 Center Tier2 Center Tier2 Center Tier2 Center 11 Tier1 and120+ Tier2 Centers ~PByte/sec ~150-1500 MBytes/sec Online System Experiment CERN Center PBs of Disk; Tape Robot Tier 0 +1 Tier 1 10 - 40 Gbps FNAL Center INFN Center IN2P3 Center RAL Center ~10 Gbps Tier 2 ~1-10 Gbps Tier 3 Institute Institute Institute Institute Tens of Petabytes by ~2010 Physics data cache 1 to 10 Gbps Tier 4 Workstations
Lookup Stub Service Skeleton Lookup Service Communication in Distributed Systems Different types of dedicated protocols Distributed Object Systems CORBA , DCOM, RMI The Stub is linked to the Client. The Client must know about the service from the beginning and needs the right stub for it “Traditional” Distributed Object Models (CORBA, DCOM) Server CLIENT “IDL” Compiler The Server and the client code must be created together !!
Interface Lookup Service WSDL Lookup Service Distributed Object Systems Web Services WSDL/SOAP SOAP Server CLIENT The client can dynamically generate the data structures and the interfaces for using remote objects based on WSDL Platform independent • Large overhead • Based on stateless connections
Lookup Proxy Proxy Lookup Service Service Mobile Code and Distributed Services Any well suited protocol for the application Service CLIENT Dynamic Code Loading Services can be used dynamically • Remote Services Proxy == RMI Stub • Mobile Agents Proxy == Entire Service • “Smart Proxies” Proxy adjusts to the client Act as a true dynamic service and provide the necessary functionally to be used by any other services that require such information • mechanism to dynamically discover all the “Service Units" • remote event notification for changes in the any system • lease mechanism for each registered unit Is Based on Java Iosif Legrand August 2009
The MonALISA Framework • MonALISA is a Dynamic, Distributed Service System capable to collect any type of information from different systems, to analyze it in near real time and to provide support for automated control decisions and global optimization of workflows in complex grid systems. • The MonALISA system is designed as an ensemble of autonomous multi-threaded, self-describing agent-based subsystems which are registered as dynamic services, and are able to collaborate and cooperate in performing a wide range of monitoring tasks. These agents can analyze and process the information, in a distributed way, and to provide optimization decisions in large scale distributed applications. 8 Iosif Legrand August 2009
The MonALISA Architecture Regional or Global High Level Services, Repositories & Clients HL services Secure and reliable communication Dynamic load balancing Scalability & Replication AAA for Clients Proxies Distributed System for gathering and analyzing information based on mobile agents: Customized aggregation, Triggers, Actions Agents MonALISA services Distributed Dynamic Registration and Discovery-based on a lease mechanism and remote events Network of JINI-Lookup Services Secure & Public Fully Distributed System with no Single Point of Failure 9 Iosif Legrand August 2009
MonALISA Service & Data Handling Postgres Data Store Lookup Service Lookup Service Registration Data Cache Service & DB Web Service WSDL SOAP Discovery WS Clients and service Data (via ML Proxy) Predicates & Agents Clients or Higher Level Services Configuration Control (SSL) Applications AGENTS FILTERS / TRIGGERS Collects any type of information Dynamic Loading Monitoring Modules Push and Pull 10 Iosif Legrand August 2009
MonALISA Service MonALISA Service MonALISA Service Registration / Discovery Admin Access and AAA for Clients Registration (signed certificate) Application Discovery Client (other service) Lookup Service Trust keystore Services Proxy Multiplexer Applications Data Filters & Agents Client authentication Services Proxy Multiplexer Admin SSL connection Lookup Service Client (other service) Trust keystore AAA services Iosif Legrand August 2009
Monitoring Grid sites, Running Jobs, Network Traffic, and Connectivity Running Jobs JOBS TOPOLOGY ACCOUNTING 12 Iosif Legrand August 2009
Job1 Job Job Job2 Job 31 Job3 Job 32 Monitoring the Execution of Jobs and the Time Evolution SPLIT JOBS LIFELINES for JOBS Summit a Job DAG 13 Iosif Legrand August 2009
Monitoring CMS Jobs Worldwide Rate of collected monitoring values Total Collected values X109 1000 ~ 5 *109 Monitoring values Collected in the first half of 2009 The computer that runs ML at CERN was replaces 4 3 500 2 1 0 May June April May June CMS is using MonALISA and ApMon to monitor all the production and analysis jobs. This information is than used in the CMS dashboard frontend Organize and structure Monitoring Information • Collects monitoring data with rates up to more than 1000 values per second • Peaks of more than 1500 jobs reporting concurrently to the same server • Uptime for the service > 150 days continuous operation without any problems • Collected 4.5* 109 monitoring values in the first half of 2009 • Lost in UDP messages (values) is less than 5 * 10-6 Iosif Legrand August 2009
Monitoring architecture in ALICE AliEn CE AliEn CE Cluster Monitor Cluster Monitor AliEn IS AliEn Optimizers AliEn Job Agent AliEn Job Agent AliEn Brokers ApMon ApMon AliEn TQ ApMon ApMon ApMon ApMon AliEn SE AliEn SE ApMon ApMon ApMon ApMon MySQL Servers ApMon ApMon ApMon CastorGrid Scripts AliEn Job Agent AliEn Job Agent AliEn Job Agent AliEn Job Agent ApMon ApMon ApMon ApMon ApMon API Services ApMon MonALISA @CERN MonALISA LCG Site MonALISA @Site job slots net In/out run time cpu time free space processes load jobs status vsz sockets rss migrated mbytes active sessions Aggregated Data nr. of files open files Queued JobAgents MonaLisa Repository job status Alerts cpu ksi2k Actions Long History DB disk used MyProxy status LCG Tools 15 Iosif Legrand August 2009
ALICE : Global Views, Status & Jobs http://pcalimonitor.cern.ch Iosif Legrand August 2009
ALICE: Job status – history plots Iosif Legrand August 2009
ALICE: Resource Usage monitoring Cumulative parameters CPU Time & CPU KSI2K Wall time & Wall KSI2K Read & written files Input & output traffic (xrootd) Running parameters Resident memory Virtual memory Open files Workdir size Disk usage CPU usage Aggregated per site Iosif Legrand August 2009
ALICE: Job agents monitoring From Job Agent itself Requesting job Installing packages Running job Done Error statuses From Computing Element Available job slots Queued Job Agents Running Job Agents Iosif Legrand August 2009
Two levels of decisions: local (autonomous), global (correlations). Actions triggered by: values above/below given thresholds, absence/presence of values, correlations between any values. Action types: alerts (emails/instant msg/atom feeds), running an external command, automatic charts annotations in the repository, running custom code, like securely ordering a ML service to (re)start a site service. Local and Global Decision Framework • Traffic • Jobs • Hosts • Apps ML Service Actions based on global information Global ML Services Actions based on local information • Temperature • Humidity • A/C Power • … ML Service Sensors Local decisions Global decisions Iosif Legrand August 2009
ALICE: Automatic job submissionRestarting Services MySQL daemon is automatically restarted when it runs out of memory Trigger: threshold on VSZ memory usage ALICE Production jobs queue is kept full by the automatic submission Trigger: threshold on the number of aliprod waiting jobs Administrators are kept up-to-date on the services’ status Trigger: presence/absence of monitored information 21 Iosif Legrand August 2009
ALICE is using the monitoring information to automatically: resubmit error jobs until a target completion percentage is reached, submit new jobs when necessary (watching the task queue size for each service account) production jobs, RAW data reconstruction jobs, for each pass, restart site services, whenever tests of VoBox services fail but the central services are OK, send email notifications / add chart annotations when a problem was not solved by a restart dynamically modify the DNS aliases of central services for an efficient load-balancing. Most of the actions are defined by few lines configuration files. Automatic actions in ALICE Iosif Legrand August 2009
The USLHCnet Advanced Standards:Dynamic Circuits CIENA Core Directors Mesh Protection Equipment and link Redundancy Also Internet2 and SINET3 (Japan) Together with ESnet provide highly resilient data paths for US Tier1s US LHCNet status report Artur Barczyk, 04/16/2009 Iosif Legrand August 2009
Monitoring Links AvailabilityVery Reliable Information AMS-GVA(GEANT) 99.5% AMS-NYC(GC) 97.9% CHI-NYC (Qwest) 99.9% CHI-GVA (GC) 96.6% CHI-GVA (Qwest) 99.3% Ref @ CERN) 98.9% GVA – NYC (Colt) 99.5% GVA – NYC (GC) 95-97% 97-98% 98-99% 99-100% 100% 0-95% P1 Network LINK P1 Artur Barczyk, 04/16/2009 Iosif Legrand August 2009
Monitoring USLHCNet Topology Topology & Status & Peering Real Time Topology for L2 Circuits Iosif Legrand August 2009
USLHCnet: Traffic on different segments Iosif Legrand August 2009
USLHCnet: Accounting for Integrated Traffic Iosif Legrand August 2009
ALARMS and Automatic notifications for USLHCnet Iosif Legrand August 2009
The UltraLight Network BNL ESnet IN /OUT Iosif Legrand August 2009
Monitoring Network Topology (L3), Latency, Routers NETWORKS ROUTERS AS Real Time Topology Discovery & Display Iosif Legrand August 2009
Available Bandwidth Measurements 31 Iosif Legrand August 2009 Embedded Pathload module.
EVO : Real-Time monitoring for Reflectorsand the quality of all possible connections Iosif Legrand August 2009
EVO: Creating a Dynamic, Global, Minimum Spanning Tree to optimize the connectivity A weighted connected graph G = (V,E) with n vertices and m edges. The quality of connectivity between any two reflectors is measured every second. Building in near real time a minimum- spanning tree with addition constrains Resilient Overlay Network that optimize real-time communication Iosif Legrand August 2009
Dynamic MST to optimize the Connectivity for Reflectors Frequent measurements of RTT, jitter, traffic and lost packages The MST is recreated in ~ 1 S case on communication problems. Iosif Legrand August 2009
EVO: Optimize how clients connect to the system for best performance and load balancing Iosif Legrand August 2009
FDT – Fast Data Transfer • FDT is an application for efficient data transfers. • Easy to use. Written in java and runs on all major platforms. • It is based on an asynchronous, multithreaded system which is using the NIO library and is able to: • stream continuously a list of files • use independent threads to read and write on each physical device • transfer data in parallel on multiple TCP streams, when necessary • use appropriate size of buffers for disk IO and networking • resume a file transfer session 36 Iosif Legrand August 2009
FDT – Fast Data Transfer Control connection / authorization Pool of buffers Kernel Space Pool of buffers Kernel Space Data Transfer Sockets / Channels Restore the files from buffers Independent threads per device 37 Iosif Legrand August 2009
FDT features • The FDT architecture allows to "plug-in" external security APIs and to use them for client authentication and authorization. Supports several security schemes : • IP filtering • SSH • GSI-SSH • Globus-GSI • SSL • User defined loadable modules for Pre and Post Processing to provide support for dedicated MS system, compression … • FDT can be monitored and controlled dynamically by MonALISA System April 2007 Iosif Legrand 38 Iosif Legrand August 2009
FDT – Memory to Memory Tests in WAN ~9.4 Gb/s ~9.0 Gb/s CPUs Dual Core Intel Xenon @ 3.00 GHz, 4 GB RAM, 4 x 320 GB SATA Disks Connected with 10Gb/s Myricom October 2006 Iosif Legrand 39 Iosif Legrand August 2009
Disk -to- Disk transfers in WAN 1U Nodes with 4 Disks 4U Disk Servers with 24 Disks CERN CALTECH NEW YORK GENEVA Reads and writes on two 12-port RAID Controllers in parallel on each server Mean traffic ~ 545 MB/s ~ 2 TB per hour Reads and writes on 4 SATA disks in parallel on each server Mean traffic ~ 210 MB/s ~ 0.75 TB per hour MB/s • Lustre read/ write ~ 320 MB/s between Florida and Caltech • Works with xrootd • Interface to dCache using the dcap protocol October 2007 Iosif Legrand Iosif Legrand August 2009
Active Available Bandwidth measurements between all the ALICE grid sites Iosif Legrand August 2009
Active Available Bandwidth measurements between all the ALICE grid sites (2) Iosif Legrand August 2009
End to End Path Provisioning on different layers Default IP route Layer 3 Site B VCAT and VLAN channels Layer 2 Site A Optical path Layer 1 Monitor layout / Setup circuit Monitor interfaces traffic Monitor host & end-to-end paths / Setup end-host parameters Control transfers and bandwidth reservations Iosif Legrand August 2009
Monitoring Optical Switches Dynamic restoration of lightpath if a segment has problems Iosif Legrand August 2009
Monitoring the Topology and Optical Power on Fibers for Optical Circuits Controlling Port power monitoring Glimmerglass Switch Example Iosif Legrand August 2009
“On-Demand”, End to End Optical Path Allocation >FDT A/fileX B/path/ OS path available Configuring interfaces Starting Data Transfer CREATES AN END TO END PATH < 1s Real time monitoring Internet MonALISA Distributed Service System Regular IP path APPLICATION DATA MonALISA Service Monitor Control A OS Agent B LISA AGENT LISA sets up - Network Interfaces - TCP stack - Kernel parameters - Routes LISA APPLICATION “use eth1.2, …” LISA Agent TL1 Optical Switch Active light path Detects errors and automatically recreate the path in less than the TCP timeout 46 Iosif Legrand August 2009
Controlling Optical Planes Automatic Path Recovery CERN Geneva USLHCnet Internet2 Starlight CALTECH Pasadena Manlan 200+ MBytes/sec From a 1U Node FDT Transfer “Fiber cut” simulations The traffic moves from one transatlantic line to the other one FDT transfer (CERN – CALTECH) continues uninterrupted TCP fully recovers in ~ 20s 4 2 3 1 4 fiber cut emulations 4 Fiber cuts simulations Iosif Legrand August 2009
“On-Demand”, Dynamic Circuits Channel and Path Allocation APPLICATION >FDT A/fileX B/path/ path or channel allocation Configuring interfaces Starting Data Transfer Regular IP path Regular IP path Local VLANs MAP Local VLANs to WAN channels or light paths • Recommended to use two NICs • one for management /one for data • - bonding two NICs to the same IP Iosif Legrand August 2009
The Need for Planning and Scheduling for Large Data Transfers In Parallel Sequential 2.5 X Faster to perform the two reading tasks sequentially Iosif Legrand August 2009
Dynamic Path Provisioning Queueing and Scheduling • Channel allocation based on VO/Priority, [ + Wait time, etc.] • Create on demand a End-to-end path or Channel & configure end-hosts • Automatic recovery (rerouting) in case of errors • Dynamic reallocation of throughputs per channel: to manage priorities, control time to completion, where needed • Reallocate resources requested but not used Request User Scheduling Control Realtime Feedback Monitoring End Host Agents Iosif Legrand August 2009