Download

1 / 43
430 likes | 559 Vues
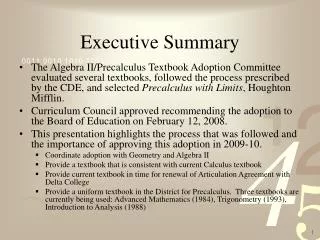
Executive Summary. Dean Dennis A. Savaiano Alastair Morrison, Associate Dean, Learning Homepage URL Address www.cfs.purdue.edu Academic Department Child Development & Family Studies Consumer Sciences & Retailing Foods & Nutrition Hospitality & Tourism Management Employees

E N D
Executive Summary Dean Dennis A. Savaiano Alastair Morrison, Associate Dean, Learning Homepage URL Addresswww.cfs.purdue.edu Academic Department Child Development & Family Studies Consumer Sciences & Retailing Foods & Nutrition Hospitality & Tourism Management Employees Tenure/TT Faculty 61 Non-TT, Lecturers, Post Doc 11 Administrative Staff 16 Professional Staff 55 Clerical Staff 46 Service Staff 75 Graduate Student Staff 139 Adjunct Faculty 20 Total 424 Annual Operating Budget State Funds $8,341,242 Sponsored Research $7,037,752 Federal Appropriations $757,325 Gifts & Misc. Other $2,469,084 Total $18,605,403 Students Graduate Enrollment 197 Child Development & Family Studies 75 Consumer Sciences & Retailing 36 Foods & Nutrition 48 Hospitality & Tourism Management 38 Undergraduate Enrollment 1,953 Child Development & Family Studies 303 Consumer Sciences & Retailing 701 Foods & Nutrition 204 Hospitality & Tourism Management 593 CFS Education 45 Undecided 104 Non-Degree 3 Instruction Average Organized Class Size 30
CFS Department Heads and Program Directors Department Heads Child Development & Family Studies William Graziano, Ph.D. Consumer Sciences & Retailing Richard Widdows, Ph.D. Foods & Nutrition Connie Weaver, Ph.D. Hospitality & Tourism Management Raphael Kavanaugh, Ed.D. Program Directors Alumni and Donor Relations Amy Liter Business Services Angie Delworth CFS EducationWanda Fox Development Betty Krejci Margaret Tittle Linda Young Information Services David Fisher International & Multicultural Programs Alastair Morrison Professional Development Don Anderson Student Services Linda Conner Undergraduate Recruiting, Retention, and Placement Teresa Eloff
Historical Enrollment by Student Level 1994-95 1999-00 2000-01 2001-02 2002-03 2003-04 Undergraduate 1,451 1,763 1,863 1,930 1,926 1953 Graduate 201 175 174 181 188 197 CFS Total 1,652 1,938 2,037 2,111 2,114 2150 University Total 34,484 37,762 37,871 38,208 38,564 38,847 % of University Total 4.79 5.13 5.38 5.53 5.48 5.53
Undergraduate Historical Enrollment by Residence 1994-95 1999-00 2000-01 2001-02 2002-03 2003-04 Indiana 1,116 1,419 1,469 1,518 1,511 1523 Other States 289 280 324 350 341 357 US Territory 19 23 24 20 17 24 International 27 41 46 42 57 49 Total CFS1451 1,763 1,863 1,930 1,926 1953 % Indiana 76.91 80.4 78.8 78.6 78.4 77.98
Undergraduate Historical Enrollment by Ethnicity 1994-95 1999-00 2000-01 2001-02 2002-03 2003-04 African American 53 58 67 72 76 64 Asian American 33 35 34 39 56 60 Hispanic 30 31 38 42 49 56 American Indian 9 11 8 11 10 9 Ethnicity Total 125 135 147 164 191 189 CFS Total 1,451 1,763 1,863 1,930 1,926 1953 % Ethnicity CFS 8.6 7.7 7.9 8.5 10.0 9.7 % Ethnicity University 10.0 9.2 9.1 9.3 10.2 10.8
Undergraduate Historical Enrollment by Classification Year 1994-95 1999-00 2000-01 2001-02 2002-03 2003-04 Freshman 277 365 344 302 273 322 Sophomore 365 447 477 493 449 404 Junior 395 461 508 537 557 567 Senior 414 488 533 594 647 657 Non-Degree -- 2 1 4 -- 3 CFS Total 1,451 1,763 1,863 1,930 1,926 1953
Undergraduate Historical Enrollment by Department 1994-95 1999-00 2000-01 2001-02 2002-03 2003-04 F&N 204 229 209 199 194 204 CSR 367 508 628 734 725 701 HTM 461 544 541 524 518 596 CDFS 339 378 363 356 362 303 CFS Education 13 29 29 44 50 45 Undecided 67 75 93 73 77 104 CFS Total 1,451 1,763 1,863 1,930 1,926 1953
Undergraduate Historical Enrollment 1994-95 1999-00 2000-01 2001-02 2002-03 2003-04 Full-Time 1,359 1,671 1,777 1,846 1,857 1878 Part-Time 92 92 86 84 69 75 Domestic 1,424 1,722 1,817 1,888 1,869 1904 International 27 41 46 42 57 49 CFS Total 1,451 1,763 1,863 1,930 1,9261953
CSR2003-04 Apparel Design & Technology 75 Financial Counseling & Planning 127 Retail Management 197 Selling & Sales Management 267 Small Business 35 Total701 HTM2003-04 Food Service & Lodging Supervision 3 Hospitality & Tourism Management 589 Restaurant, Hotel, Institution & Tourism Mgmt 4 Total596 Undergraduate Enrollment by Major (2003-04) CDFS2003-04 Early Childhood Education and Exceptional Needs 48 Early Childhood Education and Intervention 28 Individual and Family Studies 44 Youth, Adult and Family Services 183 Total303 F&N2003-04 Coordinated Dietetics 5 Dietetics 119 Food Science 14 Foods & Nutrition in Business 10 Nutrition Science 12 Nutrition, Fitness & Health 44 Total 204 CFS Education2003-04 Family & Consumer Sciences Education 27 Occupational FCS Education 18 Total45 Undecided2003-04 Undecided 104 Total104 Summary 2003-04 Number of Majors 21 Enrollment 1953
Historical Enrollment by Gender Undergraduate 1994-95 1999-00 2000-01 2001-02 2002-03 2003-04 Female 1,102 1,285 1,313 1,333 1,344 1344 Male 349 478 550 597 582 609 CFS Total 1,451 1,763 1,863 1,930 1,926 1953 % Female CFS 75.9 72.8 70.4 69.0 69.7 68.8 % Female University 42.9 43.3 42.6 41.8 41.5 40.9 Graduate Female 152 132 133 142 150 158 Male 49 43 41 39 38 39 CFS Total 201 175 174 181 188 197 % Female CFS 75.6 75.4 76.4 78.4 79.7 80.2 % Female University 36.7 36.0 36.1 36.7 37.0 37.4 Total Female 1,254 1,417 1,446 1,475 1,494 1502 Male 398 521 591 636 620 648 % Female CFS 75.9 73.1 71.0 69.9 70.7 69.8 % Female University 41.7 42.6 42.2 41.7 41.5 40.3
Historical Enrollment by Ethnicity Undergraduate 1994-95 1999-00 2000-01 2001-02 2002-03 2003-04 African American 53 58 67 72 76 64 Asian American 33 35 34 39 56 60 Hispanic 30 31 38 42 49 56 American Indian 9 11 8 11 10 9 Non-Ethnic 1,326 1,628 1,716 1,766 1,735 1764 Graduate African American 6 6 7 8 5 8 Asian American 10 5 5 5 6 4 Hispanic 4 5 3 3 4 3 American Indian 1 2 -- -- -- -- Non-Ethnic 180 157 159 165 173 182 Total Total CFS 1652 1,938 2,037 2,111 2,114 2150 Total Ethnicity 146 153 162 180 206 204 % Ethnicity CFS 8.8 7.9 8.0 8.5 9.7 9.5 % Ethnicity University 10.1 9.3 9.2 9.3 10.0 10.4
Historical Enrollment by International Students 1994-95 1999-00 2000-01 2001-02 2002-03 2003-04 Undergraduate 27 41 46 42 57 49 *Graduate 80 78 76 82 96 100 *Total International 107 119 122 124 153 149 % Undergraduate CFS 1.8 2.3 2.4 2.1 2.9 2.5 % Graduate CFS 39.8 44.5 43.6 45.3 51.0 50.7 *% Total CFS 6.48 6.14 5.99 5.87 7.24 6.93 *Reflects data correction
Historical Enrollment by Department Undergraduate 1994-95 1999-00 2000-01 2001-02 2002-03 2003-04 F&N 204 229 209 199 194 204 CSR 367 508 628 734 725 701 HTM 461 544 541 524 518 596 CDFS 339 378 363 356 362 303 CFS Education 13 29 29 44 50 45 Undecided 67 75 93 73 77 104 Total 1451 1763 1863 1930 1926 1953 Graduate F&N 43 43 38 45 42 48 CSR 36 37 41 25 33 36 HTM 34 32 25 37 41 38 CDFS 88 63 70 74 72 75 Total 201 175 174 181 188 197 Total CFS1,652 1,938 2,037 2,111 2,114 2150
Degrees Conferred 1994-95 1999-00 2000-01 2001-02 2002-03 2003-04 F&N 42 52 56 42 35 68 CSR 128 146 146 188 239 244 HTM 162 164 149 160 170 160 CDFS 88 109 115 112 125 130 CFS Education 4 6 6 10 10 14 CFS Total 424 477 472 512 579 616
Degrees Conferred by Degree Level 1994-95 1999-00 2000-01 2001-02 2002-03 2003-04 Associate -- 1 2 3 1 2 Baccalaureate 369 419 424 468 533 567 Master’s 30 40 28 29 26 26 Doctorate 25 17 18 12 19 21 CFS Total 424 477 472 512 579 616
Classes by Instructor Position and Type of Instruction Tenured and Graduate Tenure Track Non-tenured Student All Other Percent of faculty faculty Staff Instructors Total Classes ORGANIZED CLASS INSTRUCTION 113 74 33 40 261 65% Percent of all organized classes 44% 29% 13% 15% 100% Non-Laboratory class instruction Primary(1) 96 21 20 17 155 Secondary(2) 1 0 2 9 12 Total non-lab class 97 21 22 26 137 Pcnt of all non-lab classes59% 13% 13% 16% 100% Laboratory class instruction Laboratory 6 11 11 2 30 Clinics(4) 10 42 0 12 64 Total lab classes 16 53 11 14 94 Pcnt of all lab classes 17% 56% 12% 15% 100% INDEPENDENT STUDY INSTRUCTION(5) 117 5 0 16 138 35% Percent of Independent Study Total 85% 4% 0% 12% 100% Individual Study 53 4 0 8 64 Experiential Learning 9 1 0 9 18 Thesis Research 698s/699s 56 0 0 0 56 ALL CLASSES 230 79 33 56 399 100% Percent of Total 58% 20% 8% 14% 100% (1) Refers to the first or primary organization of non-lab class instruction, e.g., course has only a lecture, seminar or discussion group (2) Refers to a secondary organization, e.g., a recitation, seminar, discussion or quiz group in addition to some other organizational part such as a lecture (3) Refers to lab situations where the instructional materials are designed, set up and staffed in a manner which allows students to work at own pace (4) Refers to situations where students are engaged in the practice and use of techniques for improving the health of animate patients (5) Refers to independent study sections Source: Space Management and Academic Scheduling
Classes by Instructor Position, Type of Instruction & Class Level Tenured and Graduate Tenure Track Non-tenured Student All Other Percent of faculty faculty Staff Instructors Total Classes Primary Class Instruction 000-199 20 1 2 5 28 200-299 12 5 13 3 33 300-399 24 6 2 1 33 400-499 18 10 3 6 36 500-599 10 0 0 1 11 600-699 13 0 0 1 14 Total 96 21 20 17 155 59% Percent of all Primary Class 62% 14% 13% 11% 100% Secondary Class Instruction 000-199 0 0 0 8 8 400-499 1 0 2 1 4 Total 1 0 2 9 12 5% Percent of all Secondary Class 8% 0% 17% 75% 100% Laboratory Class Instruction* 000-199 0 0 0 0 0 200-299 2 47 4 1 54 300-399 0 1 0 0 1 400-499 8 5 7 13 33 500-599 1 0 0 0 1 600-699 5 0 0 0 5 Total 16 53 11 14 94 36% Percent of all Laboratory Class 17% 56% 12% 15% 100% Total Organized Classes 113 74 33 40 261 100% Percent of Total 44% 29% 13% 15% 100% *Include lab, lab prep, auto tutorial self-paced labs, and clinics Source: Space Management and Academic Scheduling
Student Credit Hours by Instructor Position/Type of Instruction Tenured and Graduate Tenure Track Non-tenured Student All Other Percent of faculty faculty Staff Instructors Total Classes ORGANIZED CLASS INSTRUCTION 11,263 3,359 3,691 1,506 19,819 93% Percent of all organized classes 57% 17% 19% 8% 100% Non-Laboratory class instruction Primary(1) 11,013 2,983 3,346 1,278 18,620 Secondary(2) 81 0 39 169 289 Total non-lab class 11,094 2,983 3,385 1,447 18,909 Pcnt of all non-lab classes 59% 16% 18% 8% 100% Laboratory class instruction Laboratory 129 334 306 47 816 Clinics(3) 40 42 0 12 94 Total lab classes 169 376 306 59 910 Pcnt of all lab classes 19% 41% 34% 7% 100% INDEPENDENT STUDY INSTRUCTION 954 33 0 610 1,598 7% Percent of Independent Study Total 60% 2% 0% 38% 100% Individual Study 340 13 0 100 453 Experiential Learning 63 20 0 510 593 Thesis Research 698s/699s 552 0 0 0 552 ALL STUDENT CREDIT HOURS 12,218 3,392 3,691 2,116 21,417 100% Percent of Total 57% 16% 17% 10% 100% (1) Refers to the first or primary organization of non-lab class instruction, e.g., course has only a lecture, seminar or discussion group (2) Refers to a secondary organization, e.g., a recitation, seminar, discussion or quiz group in addition to some other organizational part such as a lecture (3) Refers to situations where students are engaged in the practice and use of techniques for improving the health of animate patients Source: Space Management and Academic Scheduling
Student Credit Hours by Instructor Position/Principal Instructional Type Tenured and Graduate Tenure Track Non-tenured Student All Other Percent of faculty faculty Staff Instructors Total Classes ORGANIZED CLASS INSTRUCTION 11,444 3,381 3,624 1,668 20,116 94% Percent of all organized classes 57% 17% 18% 8% 100% Non-Laboratory class instruction Primary(1) 11,412 3,364 3,481 1,590 19,847 Secondary(2) 0 0 0 34 34 Total non-lab class 11,412 3,364 3,481 1,624 19,881 Pcnt of all non-lab classes 57% 17% 18% 8% 100% Laboratory class instruction Laboratory 0 17 143 43 203 Clinics(3) 32 0 0 0 32 Total lab classes 32 17 143 43 235 Pcnt of all lab classes 14% 7% 61% 18% 100% INDEPENDENT STUDY INSTRUCTION 954 33 0 359 1,347 6% Percent of Independent Study Total 71% 2% 0% 27% 100% Individual Study 340 13 0 100 453 Experiential Learning 63 20 0 259 342 Thesis Research 698s/699s 552 0 0 0 552 ALL STUDENT CREDIT HOURS 12,398 3,414 3,624 2,027 21,463 100% Percent of Total 58% 16% 17% 9% 100% (1) Refers to the first or primary organization of non-lab class instruction, e.g., course has only a lecture, seminar or discussion group (2) Refers to a second organization, e.g., a recitation, seminar, discussion or quiz group in addition to some other organizational part such as a lecture (3) Refers to situations where students are engaged in the practice and use of techniques for improving the health of animate patients Source: Space Management and Academic Scheduling
Student Credit Hours by Instructor Position, Type of Instruction & Class Level Tenured and Graduate Tenure Track Non-tenured Student All Other Percent of faculty faculty Staff Instructors Total Classes Primary Class Instruction 000-199 2,751 108 459 48 3,367 200-299 1,403 707 2,247 942 5,299 300-399 4,174 1,408 425 13 6,019 400-499 1,946 760 215 160 3,081 500-599 401 0 0 111 512 600-699 338 0 0 5 342 Total Primary Credit Hours 11,013 2,983 3,346 1,278 18,620 94% Percent of all Primary Class 59% 16% 18% 7% 100% Secondary Class Instruction 000-199 0 0 0 95 95 400-499 81 0 39 74 194 Total Secondary Credit Hours 81 0 39 169 289 1% Percent of all Secondary Class 28% 0% 14% 58% 100% Laboratory Class Instruction* 200-299 73 159 143 43 418 300-399 0 38 0 0 38 400-499 25 179 163 16 383 500-599 9 0 0 0 9 600-699 62 0 0 0 62 Total Lab Credit Hours 169 376 306 59 910 5% Percent of all Secondary Class 17% 56% 12% 15% 100% Total Organized Classes Credit Hours 11,263 3,359 3,691 1,506 19,819 100% Percent of Total 57% 17% 19% 8% 100% *Include lab, lab prep, auto tutorial self-paced labs, and clinics Source: Space Management and Academic Scheduling
Weekly Student Class Hours by Instructor Position/Type of Instruction Tenured and Graduate Tenure Track Non-tenured Student All Other Percent of faculty faculty Staff Instructors Total Classes ORGANIZED CLASS INSTRUCTION Non-Laboratory class instruction89% Primary(1) 11,360 3,029 3,438 1,441 19,267 Secondary(2) 81 0 23 175 279 Total non-lab class 11,441 3,029 3,462 1,615 19,547 Pcnt of all non-lab classes 59% 1% 18% 8% 100% Laboratory class instruction11% Laboratory 445 771 827 139 2,181 Clinics(4) 93 109 0 31 233 Total lab classes 538 880 827 169 2,414 Pcnt of all lab classes 22% 36% 34% 7% 100% All WSCH OF ORGANIZED CLASSES 11,979 3,909 4,289 1,785 21,961 100% Percent of all organized WSCH (a) 55% 18% 20% 8% 100% (1) Refers to the first or primary organization of non-lab class instruction, e.g., course has only a lecture, seminar or discussion group (2) Refers to a secondary organization, e.g., a recitation, seminar, discussion or quiz group in addition to some other organizational part such as a lecture (3) Refers to lab situations where the instructional materials are designed, set up and staffed in a manner which allows students to work at own pace (4) Refers to situations where students are engaged in the practice and use of techniques for improving the health of animate patients (a) IWSCH=imputed Weekly Student Class Hours are calculated values based on per-course-enrollment factors for each of the Independent Study Instructional Types since the types do not have definite time statements associated with them. Source: Space Management and Academic Scheduling
WSCH* by Instructor Position, Type of Instruction and Class Level Tenured and Graduate Tenure Track Non-tenured Student All Other Percent of faculty faculty Staff Instructors Total Classes Primary Class Instruction 000-199 2,898 113 470 132 3,612 200-299 1,427 736 2,310 949 5,422 300-399 4,289 1,395 429 15 6,128 400-499 1,963 786 229 173 3,151 500-599 446 0 0 113 559 600-699 336 0 0 59 395 Total Primary WSCH 11,360 3,029 3,438 1,441 19,267 88% Percent of all Primary WSCH 59% 16% 18% 7% 100% Secondary Class Instruction 000-199 0 0 0 101 101 400-499 81 0 23 74 178 Total Secondary WSCH 81 0 23 175 279 1% Percent of all Secondary WSCH 29% 0% 8% 63% 100% Laboratory Class Instruction** 200-299 169 394 420 127 1,110 300-399 0 86 0 0 86 400-499 70 400 407 42 919 500-599 178 0 0 0 178 600-699 121 0 0 0 121 Total Lab WSCH 538 880 827 169 2,414 11% Percent of all Lab WSCH 22% 36% 34% 7% 100% Total Organized Classes 11,979 3,909 4,289 1,785 21,961 100% Percent of Total WSCH 55% 18% 20% 8% 100% **Include lab, lab prep, auto tutorial self-paced labs, and clinics *WSCH=Weekly Student Class Hours Source: Space Management and Academic Scheduling
Average Class Size by Instructor Position/Type of Instruction Tenured and Graduate Tenure Track Non-tenured Student All Other faculty faculty Staff Instructors Total ORGANIZED CLASS INSTRUCTION Non-Laboratory class instruction Primary(1) 42.9 33.6 79.3 34.7 45.4 Secondary(2) 54.0 0.0 19.5 26.6 27.7 Average Class Size for all non-lab classes 43.0 33.6 73.9 31.9 44.1 Laboratory class instruction Laboratory 18.5 13.2 15.7 9.7 14.9 Clinics(3) 2.0 1.0 0.0 1.0 1.2 Average Class Size for all lab classes 8.2 3.5 15.7 2.3 5.5 AVERAGE CLASS SIZE FOR ALL ORGANIZED CLASSES 38.1 12.2 54.5 21.4 30.2 (1) Refers to the first or primary organization of non-lab class instruction, e.g., course has only a lecture, seminar or discussion group (2) Refers to a secondary organization, e.g., a recitation, seminar, discussion or quiz group in addition to some other organizational part such as a lecture (3) Refers to situations where students are engaged in the practice and use of techniques for improving the health of animate patients Source: Space Management and Academic Scheduling
Average Class Size by Instructor Position, Type of Instruction and Class Level Tenured and Graduate Tenure Track Non-tenured Student All Other faculty faculty Staff Instructors Total Primary Class Instruction 000-199 61.1 36.0 74.1 17.8 53.3 200-299 40.1 56.8 57.6 104.7 55.4 300-399 58.4 18.5 236.4 13.0 62.1 400-499 41.2 30.5 55.2 16.8 35.3 500-599 17.4 0.0 0.0 37.0 19.2 600-699 10.4 0.0 0.0 35.8 12.1 Average Class Size for Primary Classes 42.9 33.6 79.3 34.7 45.4 Secondary Class Instruction 000-199 0.0 0.0 0.0 23.8 23.8 400-499 54.0 0.0 19.5 49.0 35.5 Average Class Size for Secondary Classes 54.0 0.0 19.5 26.6 27.7 Laboratory Class Instruction* 200-299 27.5 2.0 19.8 14.6 4.5 300-399 0.0 19.0 0.0 0.0 19.0 400-499 3.1 14.4 13.4 1.2 6.3 500-599 9.0 0.0 0.0 0.0 9.0 600-699 8.4 0.0 0.0 0.0 8.4 Average Class Size for Lab Classes 8.2 3.5 15.7 2.3 5.5 Average Class Size for all Levels 38.1 12.2 54.5 21.4 30.2 *Include lab, lab prep, auto tutorial self-paced labs, and clinics Source: Space Management and Academic Scheduling
Faculty & Staff Headcounts 1998-99 1999-00 2000-01 2001-02 2002-03 2003-04 Tenured/Tenure track Faculty 64 63 60 56 58 61 Non-Tenure 13 12 13 20 14 11 Administrative Staff 17 21 22 21 20 16 Professional Staff 49 50 53 51 53 55 Clerical Staff 42 41 44 46 43 46 Service Staff 64 62 74 79 80 75 Graduate Student Staff 119 121 119 121 127 139 Adjunct Faculty 27 27 27 19 20 21 Total CFS 395 397 412 413 415424
Faculty and Staff Headcount by Ethnicity 1998-99 1999-00 2000-01 2001-02 2002-03 2003-04 African American 6 9 10 11 12 10 Asian American 12 11 8 8 10 11 Hispanic 6 6 1 5 3 3 American Indian 0 1 1 0 0 0 White and Other 314 315 331 326 320 317 International 57 55 61 63 70 83 Total CFS 395 397 412 413 415 424 Total Ethnicity 24 27 20 24 25 24 % Ethnicity 6.1 6.8 4.9 5.8 6.0 5.7
Faculty and Staff Headcount by Gender 1998-99 1999-00 2000-01 2001-02 2002-03 2003-04 Male 76 76 76 75 80 85 Female 319 321 336 338 335 339 Total CFS 395 397 412 413 415 424 % Female 80.8 80.9 81.6 81.8 80.7 80.0
Faculty and Staff Headcount by Department Includes FT/PT and Graduate Staff 1998-99 1999-00 2000-01 2001-02 2002-03 2003-04 CDFS 111 101 109 110 113 114 CSR 52 60 56 49 51 52 HTM 58 60 58 60 56 58 F&N 99 98 105 105 107 106 CFS* 75 78 84 89 88 94 Total CFS 395 397 412 413 415 424 *Includes T/TT Faculty, Administrative, Professional, Clerical, Service and Graduate Staff
Faculty and Staff Headcount by Classification and Gender 1998-99 1999-00 2000-01 2001-02 2002-03 2003-04 Tenured/TT % Women 53.1 52.4 53.3 44.6 43.1 44.3 Non-Tenure Track % Women 84.6 66.7 61.5 65.0 64.3 63.6 Administration % Women 82.4 81.0 90.9 95.2 90.0 93.8 Professional % Women 98.0 94.0 92.5 92.2 92.5 90.9 Clerical % Women 100 100 100 100 100 100 Service Staff % Women 93.8 95.2 93.2 92.4 95.0 88.0 Graduate Staff % Women *73.1 77.7 77.3 *81.8 78.0 79.9 Adjunct Faculty % Women 85.2 81.5 81.5 *79.0 80.0 81.0 * Corrected Figures
Faculty & Staff Headcount by Classification and Ethnicity - I 1998 1999 2000 2001 2002 2003-04 Tenured/Tenure Track 64 63 60 56 5861 Ethnic 6 7 6 6 5 6 White and Other 57 56 54 49 52 51 International 1 0 0 1 1 4 Non-Tenure Track, Lecturers, & Post Doc 13 12 13 20 14 11 Ethnic 2 2 1 1 1 0 White and Other 10 10 10 15 11 11 International 1 0 2 4 2 0 Administrative Staff 17 21 22 21 20 16 Ethnic 0 0 1 1 1 0 White and Other 17 21 21 20 19 16 Professional Staff 49 50 53 51 53 55 Ethnic 3 2 1 4 5 4 White and Other 45 47 49 46 47 49 International 1 1 3 1 1 0
Faculty & Staff Headcount by Classification and Ethnicity - II 1998 1999 2000 2001 2002 2003 Clerical 42 41 44 46 4346 Ethnic 1 2 2 0 0 0 White and Other 41 39 42 46 43 46 Service Staff 64 62 74 79 80 75 Ethnic 2 1 0 0 1 3 White and Other 62 61 74 79 78 71 International 0 0 0 0 1 1 Graduate Student Staff 119 121 119 121 127 139 Ethnic 9 12 9 12 12 11 White and Other 57 57 57 53 51 53 International 53 52 53 56 64 75 Adjunct Faculty 27 27 27 19 20 21 Ethnic 1 1 0 0 0 0 White and Other 25 24 24 18 19 20 International 1 2 3 1 1 1 Total CFS 395 397 412 413 415424
Tenured and Tenure Track Faculty Headcount by Department 1998 1999 2000 2001 2002 2003 CDFS 19 19 19 15 15 15 CSR 14 12 11 10 11 13 HTM 14 15 14 14 15 16 F&N 14 14 13 14 14 14 CFS Administration 3 3 3 3 3 3 Total CFS 64 63 60 56 58 61
Tenured and Tenure Track Faculty Headcount by Gender 1998 1999 2000 2001 2002 2003 Men 30 30 28 31 33 34 Women 34 33 32 25 25 27 Total CFS 64 63 60 56 58 61 % Women Faculty CFS53.1 52.4 53.3 44.6 43.1 44.3 % Women Faculty Uni. 20.6 21.2 21.7 22.2 22.2 22.8
Tenured and Tenure Track Faculty Headcount by Ethnicity Headcount 1998 1999 2000 2001 2002 2003 Ethnic 6 7 6 6 5 6 White and Other 57 56 54 49 52 51 International 1 0 0 1 1 4 Total CFS 64 63 60 56 58 61 *Total University 1725 1705 1694 1692 1704 1746 * Corrected Data
Tenured & Tenure Track Faculty by Gender & Rank Rank Gender 1998-99 1999-00 2000-01 2001-02 2002-03 2003-04 Professors Male 13 12 9 11 13 13 Female 8 9 11 10 10 9 Total 21 21 20 21 23 22 % Female 38% 43% 55% 48% 43% 41% Associate Professors Male 8 11 13 14 14 16 Female 13 13 11 8 7 7 Total 21 24 24 22 21 23 %Female 62% 54% 46% 36% 33% 30% Assistant Professors Male 9 7 6 6 6 5 Female 13 11 9 7 8 11 Total 22 18 15 13 14 16 %Female 59% 61% 60% 54% 57% 69% Total CFS 64 63 60 56 58 61
Faculty Nominations and Promotions 1998 1999 2000 2001 2002 2003 To Professor Men Nominated 0 0 1 0 0 1 Promoted 0 0 1 0 0 1 Women Nominated 1 3 2 1 0 1 Promoted 1 2 1 1 0 1 Total Nominated 1 3 3 1 0 2 Promoted 1 2 2 1 0 2 Ethnicity Nominated 0 1 0 0 0 1 Promoted 0 1 0 0 0 1 To Associate Men Nominated 3 1 2 0 2 1 Promoted 3 1 2 0 2 1 Women Nominated 1 3 0 0 1 1 Promoted 1 2 0 0 1 1 Total Nominated 4 4 2 0 3 2 Promoted 4 3 2 0 3 2 Ethnicity Nominated 1 0 1 0 0 0 Promoted 1 0 1 0 0 0 Total (Professor + Associate) Nominated 5 7 5 1 3 4 Promoted 5 5 4 1 3 4
Sponsored Program Awards & Baseline Funding Awards by Sponsor/Source ($)Awards by Mission ($) Federal 5,504,620 Instruction 93,527 Industrial 1,579,135 Other Sponsored Programs 1,899,714 Internal 305,160 Research 6,975,407 State 1,579,733 Total 8,968,648 Total 8,968,648 • Will report: • Baseline Funding: a) Internal from • Department/College/University • (Base Budget) b) Agricultural Experiment Station c) Internal Cooperative Extension • Sponsored Program Awards • Federal Competitive • Private • State Competitive • Sponsored Program Expenditures • Graduate Assistantships • Teaching Assistantships • Research Assistantships • Gifts and Development (non-sponsored programs) Budgeted Baseline Funding ($) State Funds 8,341,242 Set Sponsored Research 7,037,752 Estimate Federal Appropriations 757,325 Set Gifts/Misc. Other 2,469,084 Estimate Total 18,605,403 Finance Source: DSS Human Resource Data