Download
1 / 7
70 likes | 78 Vues
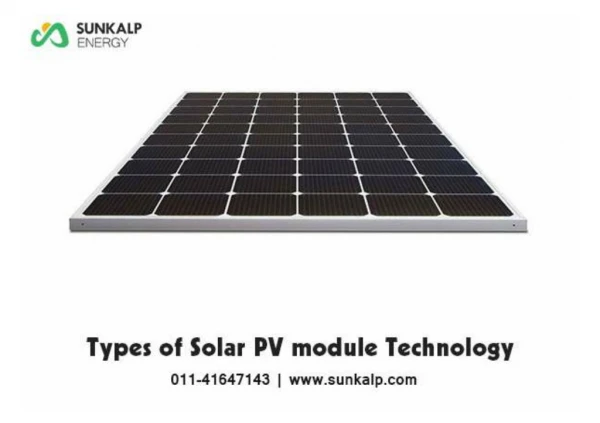
Recent applications in remote areas need low cost source of power. Standalone PV system could assure this power. This paper includes the effect of variation of parameters of PV panel model in MATLAB Simulink. This build model is based on mathematical equations of the equivalent circuits which consists of a current source, series resistance, and parallel resistance along with a diode. The model is built for the predetermination of nature of the Solar PV module for different radiation, temperature and other physical parameters. Moreover, PV array system has been studied in the given research work. For the validation of Simulink results, a real time set also has been studied. Himanshu Sharma | Pankaj Kumar | Jagannath Patra | Nitai Pal "Effects of Parameter Variations of PV Module based on MATLAB-Simulink Modeling" Published in International Journal of Trend in Scientific Research and Development (ijtsrd), ISSN: 2456-6470, Volume-1 | Issue-4 , June 2017, URL: https://www.ijtsrd.com/papers/ijtsrd2188.pdf Paper URL: http://www.ijtsrd.com/engineering/electrical-engineering/2188/effects-of-parameter-variations-of-pv-module-based-on-matlab-simulink-modeling/himanshu-sharma<br>

E N D
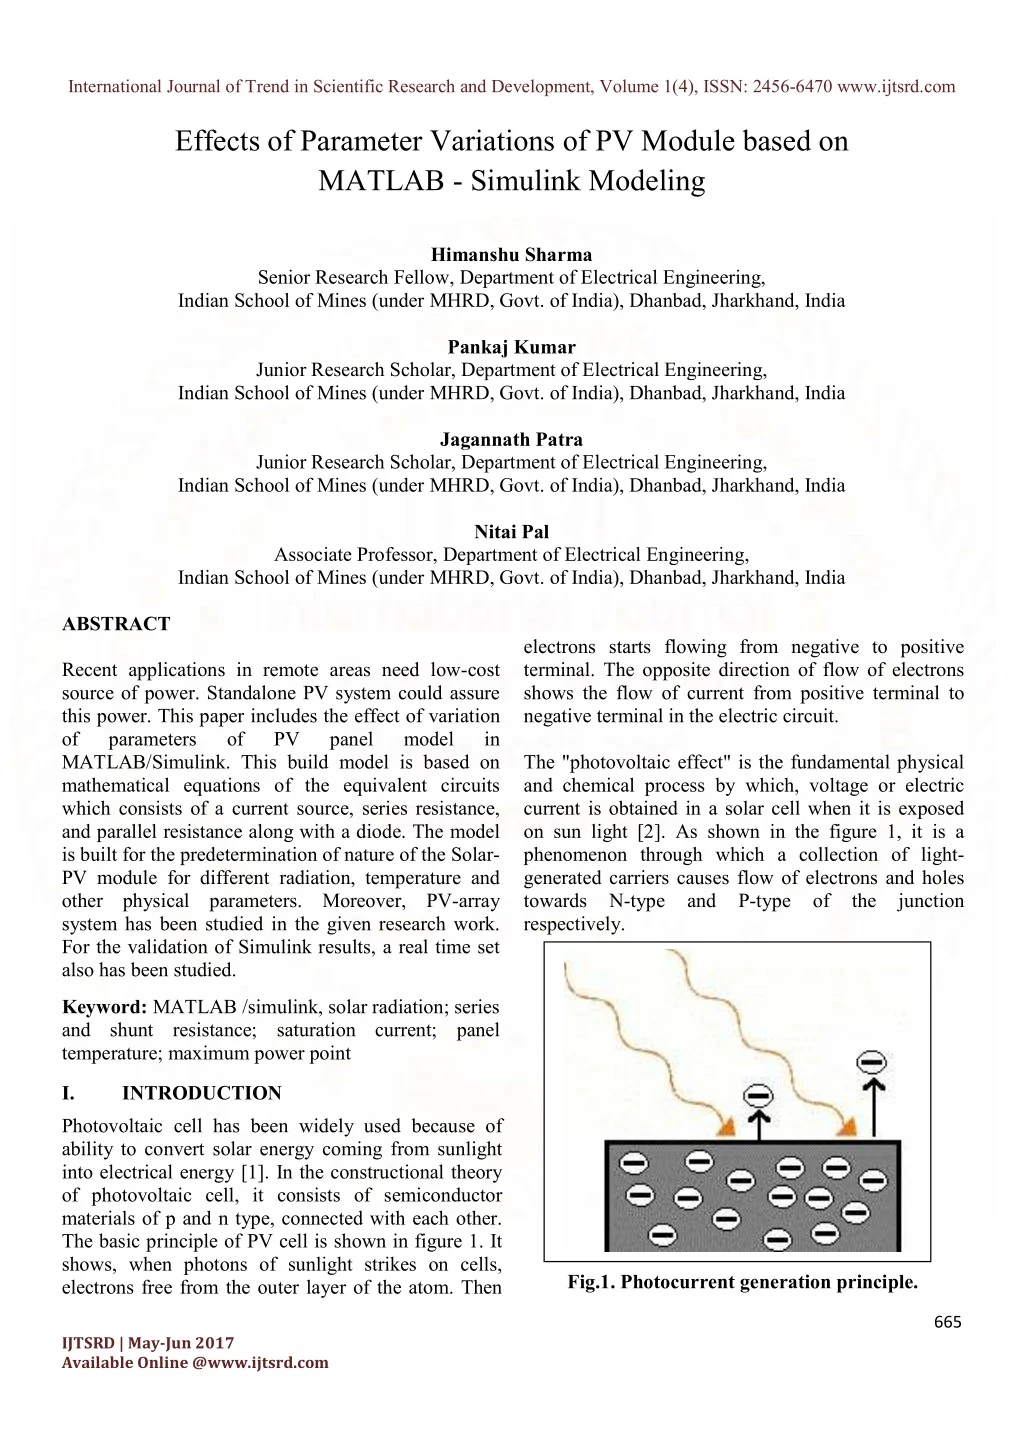
International Journal of Trend in Scientific Research and Development, Volume 1(4), ISSN: 2456-6470 www.ijtsrd.com Effects of Parameter Variations of PV Module based on MATLAB - Simulink Modeling Himanshu Sharma Senior Research Fellow, Department of Electrical Engineering, Indian School of Mines (under MHRD, Govt. of India), Dhanbad, Jharkhand, India Pankaj Kumar Junior Research Scholar, Department of Electrical Engineering, Indian School of Mines (under MHRD, Govt. of India), Dhanbad, Jharkhand, India Jagannath Patra Junior Research Scholar, Department of Electrical Engineering, Indian School of Mines (under MHRD, Govt. of India), Dhanbad, Jharkhand, India Nitai Pal Associate Professor, Department of Electrical Engineering, Indian School of Mines (under MHRD, Govt. of India), Dhanbad, Jharkhand, India ABSTRACT Recent applications in remote areas need low-cost source of power. Standalone PV system could assure this power. This paper includes the effect of variation of parameters of PV MATLAB/Simulink. This build model is based on mathematical equations of the equivalent circuits which consists of a current source, series resistance, and parallel resistance along with a diode. The model is built for the predetermination of nature of the Solar- PV module for different radiation, temperature and other physical parameters. Moreover, PV-array system has been studied in the given research work. For the validation of Simulink results, a real time set also has been studied. electrons starts flowing from negative to positive terminal. The opposite direction of flow of electrons shows the flow of current from positive terminal to negative terminal in the electric circuit. The "photovoltaic effect" is the fundamental physical and chemical process by which, voltage or electric current is obtained in a solar cell when it is exposed on sun light [2]. As shown in the figure 1, it is a phenomenon through which a collection of light- generated carriers causes flow of electrons and holes towards N-type and P-type of the junction respectively. panel model in Keyword: MATLAB /simulink, solar radiation; series and shunt resistance; saturation current; panel temperature; maximum power point I. INTRODUCTION Photovoltaic cell has been widely used because of ability to convert solar energy coming from sunlight into electrical energy [1]. In the constructional theory of photovoltaic cell, it consists of semiconductor materials of p and n type, connected with each other. The basic principle of PV cell is shown in figure 1. It shows, when photons of sunlight strikes on cells, electrons free from the outer layer of the atom. Then Fig.1. Photocurrent generation principle. 665 IJTSRD | May-Jun 2017 Available Online @www.ijtsrd.com
International Journal of Trend in Scientific Research and Development, Volume 1( International Journal of Trend in Scientific Research and Development, Volume 1(4), ISSN: 4), ISSN: 2456-6470 www.ijtsrd.com This acts as a source of current. Because of the high cost of PV modules, optimal exploitation of the available abundant solar energy is imperative [3]. This needs a precise, consistent and comprehensive simulation of the designed system before installation. PV panel modeling is a very important factor that This acts as a source of current. Because of the high cost of PV modules, optimal exploitation of the available abundant solar energy is imperative needs a precise, consistent and comprehensive simulation of the designed system before installation. PV panel modeling is a very important factor that affects the output of the PV panel. stands for the Boltzmann's constant, T denotes the junction temperature, N represents the ideality factor of the diode, Rs and Rsh are the series and shunt resistors of the cell respectively [10]. stands for the Boltzmann's constant, T denotes the junction temperature, N represents the i of the diode, Rs and Rsh are the series and shunt resistors of the cell respectively The simplest way of representing the solar cell is the diode model. It is shown with a current source . A single PV cell generates 0.8V and therefore, connected in series in a number of 36 to 72 to make PV module. Short circuit current (Ishc), open circuit voltage (Voc) and diode ideality factor are the required parameter for the circuit. Diode ideality factor can be obtained from the principle that describes how nearly it follows ideal diode equation. The basic model is improved for accuracy by introducing the series resistance (Rs). It does not prove to be efficient under temperature . To overcome this drawback, an additional shunt resistance (Rsh) is included. This paper carried out a model of PV panel of 72 cells connected in series in MATLAB/Simulink. The Proposed model is used to forecast the PV panel s by varying parameters such as solar radiation and ambient temperature. Moreover, same model is used to predict the behavior of the solar panel by varying circuit parameters such as series resistor, shunt resistor, diode The simplest way of representing the solar cell is the single diode model. It is shown with a current source parallel with a diode [2]. A single PV cell generates 0.5-0.8V and therefore, connected in series in a number of 36 to 72 to make PV module. Short circuit current (Ishc), open circuit voltage (Voc) and diode ideality factor are the required parameter fo circuit. Diode ideality factor can be obtained from the principle that describes how nearly it follows ideal diode equation. The basic model is improved for accuracy by introducing the series resistance (Rs). It does not prove to be efficient under t variations [4] [5]. To overcome this drawback, an additional shunt resistance (Rsh) is included. This paper carried out a model of PV panel of 72 cells connected in series in MATLAB/Simulink. The Proposed model is used to forecast the PV panel characteristics by varying parameters such as solar radiation and ambient temperature. Moreover, same model is used to predict the behavior of the solar panel by varying circuit parameters such as series resistor, shunt resistor, diode saturation current, etc [6] [7] [8]. The single diode model and double diode model has been extensively used in the many literatures but single diode model is more effective due to its comprehensive approach towards the modeling II. Equivalent Single Diode Circuit of photovoltaic Cell Figure 2 shows the equivalent circuit of photovoltaic cell. The main components of the circuit have a current source, a diode, a shunt resistance as well as a parallel resistance. The equivalent circuit is based on the equation given below Fig. 2. Equivalent circuit of the solar cell. Fig. 2. Equivalent circuit of the solar cell. The power output of the photovoltaic cell is based on the external input such as solar irradiation, temperature and internal parameters like Iph, Is, Rs & The power output of the photovoltaic the external input such as solar irradiation, temperature and internal parameters like Iph, Is, Rs & Rsh. different different physical physical Fig 3 Model Fig 3 Model The single diode model and double diode model has been extensively used in the many literatures but single diode model is more effective due to its comprehensive approach towards the modeling [9]. Fig. 3. PV cell MATLAB/Simulink model. Fig. 3. PV cell MATLAB/Simulink model. Equivalent Single Diode Circuit of photovoltaic Figure 2 shows the equivalent circuit of photovoltaic cell. The main components of the circuit have a current source, a diode, a shunt resistance as well as a equivalent circuit is based on (1) I I I I ph D sh q V RsI V RsI (2) I I I exp 1 ph SC NKT Rsh Rsh where, Iph represents the photocurrent, denotes the reverse saturation current of the diode, q stands for the where, Iph represents the photocurrent, denotes the reverse saturation current of the diode, q stands for the electron charge, V is the voltage across the diode, K electron charge, V is the voltage across the diode, K Fig. 4. I-V curves and P V curves and P-V curves for a given PV cell. 666 IJTSRD | May-Jun 2017 Available Online @www.ijtsrd.com
International Journal of Trend in Scientific Research and Development, Volume 1( International Journal of Trend in Scientific Research and Development, Volume 1(4), ISSN: 4), ISSN: 2456-6470 www.ijtsrd.com The MATLAB/Simulink model shown in the figure 3 is developed from the equation 1. Figure 4 shows the V for some particular values of The MATLAB/Simulink model shown in the figure 3 is developed from the equation 1. Figure 4 shows the graph I-V and P-V for some particular values of temperature and irradiation. III. Impact of Change in Solar Radiation Impact of Change in Solar Radiation Influence of spectral distribution of solar irradiance widely effects the output performance of a solar panel [11]. The equivalent circuit shown in figure 2 have a current source showing Iph which depends on temperature and irradiation as shown in equation 3. temperature and irradiation as shown in equation 3. of solar irradiance widely effects the output performance of a solar panel . The equivalent circuit shown in figure 2 have a current source showing Iph which depends on Fig. 7. PV when solar irradiation varies Fig. 7. PV when solar irradiation varies It can be clearly observed figure 6 and figure 7 that PV panel current and output power is directly varies with the solar irradiation. Moreover, It also shows that, as solar irradiation on the solar panel increases, the open circuit voltage (Voc), short circuit current (Ishc), Maximum current and maximum power also increases. and maximum power also increases. It can be clearly observed from the model in figure 5, figure 6 and figure 7 that PV panel current and output power is directly varies with the solar irradiation. Moreover, It also shows that, as solar irradiation on the solar panel increases, the open circuit voltage ircuit current (Ishc), Maximum current B (3) (3) I [ I K ( T 298 )] ph SC i j 1000 where, B is solar irradiation in (W/m2) and Ki = stands for the cell short circuit current. where, B is solar irradiation in (W/m 0.0017 A/°C stands for the cell short circuit current. IV. Impact of change in temperature of the panel Impact of change in temperature of the The relation between temperature of the panel and reverse saturation current (Isc) is shown in the equation 3 as: T I T I exp[( T The relation between temperature of the panel and reverse saturation current (Isc) is shown in the E T (4) g V ) 1 3 ( ) ( ) exp[( ] S S T N . nom nom t Fig.5. Iph MATLAB/Simulink model. Fig.5. Iph MATLAB/Simulink model. Fig. 8. MATLAB/Simulink on diode reverse Fig. 8. MATLAB/Simulink on diode reverse saturation current. saturation current. Fig. 6. I-V curves for different solar radiations. V curves for different solar radiations. 667 IJTSRD | May-Jun 2017 Available Online @www.ijtsrd.com
International Journal of Trend in Scientific Research and Development, Volume 1( International Journal of Trend in Scientific Research and Development, Volume 1(4), ISSN: 4), ISSN: 2456-6470 www.ijtsrd.com Fig. 12. P-V curves for different Rs V curves for different Rs Fig. 9. I-V curves for different panel temperatures. V curves for different panel temperatures. The resistance connected in series is generally low. As shown in the figure 11 and 12, the short circuit current and open circuit small change in series resistance. Maximum power point shift from lower to higher value with small increase in series resistance. increase in series resistance. The resistance connected in series is generally low. As shown in the figure 11 and 12, the short circuit current and open circuit voltage remain same with the small change in series resistance. Maximum power point shift from lower to higher value with small V. VI. Impact of Change in shunt resistance(Rsh) Impact of Change in shunt resistance(Rsh) As shown in figure 13 and figure 14, with the incre in shunt resistance the power output increases. With the low value of shunt resistance large drop in the output power in the open circuit voltage can be seen. As shown in figure 13 and figure 14, with the increase in shunt resistance the power output increases. With the low value of shunt resistance large drop in the output power in the open circuit voltage can be seen. Fig. 10. P-V curves for different panel temperatures. V curves for different panel The model shown in figure 8 is developed from equation 3. As shown in figure 9 and figure 10 of I-V V graphs, the open circuit voltage as well as the short circuit currents increases and decreases with The model shown in figure 8 is equation 3. As shown in figure 9 and figure 10 of I & P-V graphs, the open circuit voltage as well as the short circuit currents increases and decreases with increasing of the temperature of the panel. increasing of the temperature of the panel. V. Impact of Changing of Series Resistance (Rs) s Resistance (Rs) Fig. 13. I-V characteristics for different Rsh V characteristics for different Rsh Fi Fig. 14. P-V curves for different Rsh curves for different Rsh Fig. 11. I-V curves for different Rs. V curves for different Rs. 668 IJTSRD | May-Jun 2017 Available Online @www.ijtsrd.com
International Journal of Trend in Scientific Research and Development, Volume 1( International Journal of Trend in Scientific Research and Development, Volume 1(4), ISSN: 4), ISSN: 2456-6470 www.ijtsrd.com VI. Effects of Varying reverse saturation Effects of Varying reverse saturation current(Isc) VII. VIII. PV Array The identical 6 PV panels connected in series with different MPPT topologies and figure 22 shows that different output current Vs voltage and power Vs Voltage grap The identical 6 PV panels connected in series with different MPPT topologies [12][13][14]. Figure 21 and figure 22 shows that different output current Vs voltage and power Vs Voltage graph. In the short circuited solar panel, voltage across the panel becomes zero. The current through the solar panel in this condition is referred as short circuit noted by as Isc as shown in In the short circuited solar panel, voltage across the panel becomes zero. The current through the solar panel in this condition is referred as short circuit current and usually denoted by as Isc as shown in figure. 15. Fig. 15. I-V curves for different Isc V curves for different Isc Fig. 17. I-V curves for the PV panel V curves for the PV panel Fig. Light generated carriers produced by the light incident on it causes the production of short circuit The short circuit current and the light generated current are same for an ideal solar panel at most reasonable resistive loss systems. Hence, Ishc is the largest current that can be drawn from the solar panel. The curves of figures.15 and 16 were plotted for four different values of Is: 0.2A, 0.4A, 0.6 and 0.8A. The influence of an increase in Is is evidently seen as decreasing the open-circuit voltage Voc. 16. P-V V curves curves for for different different Isc Isc Fig. 18. P-V curves for the PV array model V curves for the PV array model The PV modules connected in series can have faults consist of open circuits, short circuits, mismatch between PV modules, and partial shading. faults are generally caused degradation, antireflection coating deterioration, manufacturing defects[15] [15]. The PV modules connected in series can have faults consist of open circuits, short circuits, mismatch between PV modules, and partial shading. Mismatch faults are generally caused degradation, antireflection coating deterioration, Light generated carriers produced by the light incident on it causes the production of short circuit current. The short circuit current and the light generated current are same for an ideal solar panel at most reasonable resistive loss systems. Hence, Ishc is the largest current that can be drawn from the solar panel. by by encapsulant encapsulant VIII.IX. Experimental Results and Validation Experimental Results and Validation e plotted for four different values of Is: 0.2A, 0.4A, 0.6 and 0.8A. The influence of an increase in Is is evidently seen as In the real time experiment, a PV Module (model number: JP36F150) as shown in the figure 19 has been tested under the solar radiation with multimeter and thermometer to measure the temperature the Table 1. The JP36F150 model MATLAB/Simulink with the same specifications. MATLAB/Simulink with the same specifications. In the real time experiment, a PV Module (model number: JP36F150) as shown in the figure 19 has been tested under the solar radiation with multimeter and thermometer to measure the temperature listed in Voc. The JP36F150 model is is developed developed in in the the 669 IJTSRD | May-Jun 2017 Available Online @www.ijtsrd.com
International Journal of Trend in Scientific Research and Development, Volume 1( International Journal of Trend in Scientific Research and Development, Volume 1(4), ISSN: 4), ISSN: 2456-6470 www.ijtsrd.com Under the similar input conditions in the MATLAB Simulink model and real time experiment on the model number JP36F150, results are shown in the Under the similar input conditions in the MATLAB Simulink model and real time experiment on the model number JP36F150, results are shown in the figure 20 and figure 21. Rated Power(Pmax) watt Rated Power(Pmax) watt 150 Volt at Max. power(Vmp in volt) Volt at Max. power(Vmp in volt) 18.03 Open circuit voltage(Voc in volt) voltage(Voc in volt) 22.12 Current at Max. Power(Imp in Amp) Current at Max. Power(Imp in Amp) 8.32 Short circuit current(Isc in Amp) Short circuit current(Isc in Amp) 8.68 Table 1. Parameters of solar panel Table 1. Parameters of solar panel IX. X. Conclusion In MATLAB/Simulink model was proposed. Basic equivalent circuit equations of solar panel was used to develop the model. The model was simulated under different environment conditions and physical parameters like solar irradiations and ambient temperature. The JP36F150 panel of solar was used to verify experimentally wi MATLAB/Simulink model. The proposed study presents a comprehensive approach of the modeling of photovoltaic power generation system in the MATLAB/Simulink model with respect to PV power utilization. Moreover, it demonstrates the characteristics of basic components of a PV array under the different weather and physical parameters which would be very much effective to forecast the performance of any solar panel. forecast the performance of any solar panel. In MATLAB/Simulink model was proposed. Basic equations of solar panel was used to develop the model. The model was simulated under different environment conditions and physical parameters like solar irradiations and ambient temperature. The JP36F150 panel of solar was used to verify experimentally with the developed simulated MATLAB/Simulink model. this this paper, paper, a a PV PV module module and and array array Fig. 19. Setup of the JP36F150 solar laminate panel. Fig. 19. Setup of the JP36F150 solar laminate The proposed study presents a comprehensive approach of the modeling of photovoltaic power generation system in the MATLAB/Simulink model with respect to PV power utilization. Moreover, it e characteristics of basic components of a PV array under the different weather and physical parameters which would be very much effective to Fig. 20. JP36F150 solar laminate panel Fig. 20. JP36F150 solar laminate panel experimental results. experimental results. Acknowledgements Authors are thankful to the Indian School of Mines, Dhanbad and UNIVERSITY COMMISSION, Bahadurshah Zafar Marg, New Delhi, India for granting financial support under Major Research Project entitled “Development of grid Power Supply System for Remote Areas [UGC Project: F. No. 42 152/2013(SR), w.e.f. 01/04/2013]” and also grateful to the Under Secretary and Joint Secretary of UGC, India for their active co- Authors are thankful to the Indian School of Mines, Dhanbad and UNIVERSITY COMMISSION, Bahadurshah Zafar Marg, New Delhi, India for granting financial support under Major Research Project entitled “Development of Hybrid Off-grid Power Supply System for Remote Areas [UGC Project: F. No. 42 152/2013(SR 01/04/2013]” and also grateful to the Under Secretary and Joint Secretary of UGC, India for their active co operation. GRANTS GRANTS Fig. As per the Experimental and Simulation results, it has been clearly shown that the open circuit voltage, short circuit current, maximum power and maximum voltages are approximately same in both results. voltages are approximately same in both results. Fig. 21. 21. MATLAB MATLAB simulation simulation results results. Simulation results, it has been clearly shown that the open circuit voltage, short circuit current, maximum power and maximum 670 IJTSRD | May-Jun 2017 Available Online @www.ijtsrd.com
International Journal of Trend in Scientific Research and Development, Volume 1(4), ISSN: 2456-6470 www.ijtsrd.com References [9] P. H. Huang, W. Xiao, J. C. H. Peng, and J. L. Kirtley, “Comprehensive Parameterization of Solar Cell: Improved Simulation Efficiency,” IEEE Transactions on Industrial Electronics, vol. 63, no. 3, pp. 1549– 1560, 2016. Accuracy with [1] A. Tofighi, “Performance Evaluation of PV Module by Dynamic Thermal Model,” Journal of Power Technologies, vol. 93, no. 2, pp. 111– 121, 2013. [10] K. Ding, X. Bian, H. Liu, and T. Peng, “A MATLAB-Simulink-based PV module model and its application under conditions of nonuniform irradiance,” IEEE Transactions on Energy Conversion, vol. 27, no. 4, pp. 864– 872, 2012. [2] F. Reis, M. Pravettoni, J. Wemans, G. Sorasio, and M. C. Brito, “Modelling the effects of inhomogeneous irradiation and temperature profiles on CPV cells behaviour,” IEEE Journal of Photovoltaics, vol. 5, no. 1, pp. 112– 122, 2015. [11] E. S. Cells, E. F. Fern, F. A. Cruz, T. K. Mallick, and S. Sundaram, “Effect of Spectral Irradiance Variations on the Performance of Highly Efficient,” Photovoltaics, vol. 5, no. 4, pp. 1150–1157, 2015. [3] H. Liu, A. M. Nobre, D. Yang, J. Y. Ye, F. R. Martins, R. Ruther, T. Reindl, A. G. Aberle, and I. M. Peters, “The impact of haze on performance ratio and short-circuit current of PV systems in Singapore,” IEEE Journal of Photovoltaics, vol. 4, no. 6, pp. 1585–1592, 2014. IEEE Journal of [12] A. El Shahat, “PV Module Optimum Operation Modeling,” Journal of Power Technologies, vol. 94, no. 1, pp. 50–66, 2014. [4] R. D. Tapakis and A. G. Charalambides, “Performance evaluation of a photovoltaic park in Cyprus using irradiance sensors,” Journal of Power Technologies, vol. 94, no. 4, pp. 296– 305, 2014. [13] P. Sharma, S. P. Duttagupta, and V. Agarwal, “A Novel Approach for Maximum Power Tracking From Curved Thin-Film Solar Photovoltaic Arrays Environmental Conditions,” IEEE Transactions on Industrial Applications, vol. 50, no. 6, pp. 4142–4151, 2014. Under Changing [5] A. Gourbi, I. Bousmaha, M. Brahami, and A. Tilmatine, “Numerical Study of a Hybrid Photovoltaic Power Supply System,” Journal of Power Technologies, vol. 96, no. 2, pp. 137– 144, 2016. [14] F. Zebiri, A. Kessal, L. Rahmani, and A. Chebabhi, “Analysis Photovoltaic Pumping System based on Nonlinear Speed Controller,” Journal of Power Technologies, vol. 96, no. 1, pp. 40–48, 2016. and Design of [6] E. A. Silva, F. Bradaschia, M. C. Cavalcanti, and A. J. Nascimento, “Parameter Estimation Method to Improve Photovoltaic Electrical Model,” IEEE Journal of Photovoltaics, vol. 6, no. 1, pp. 278–285, 2016. the Accuracy of [15] T. Temperature, Y. Hu, W. Cao, S. Member, J. Ma, S. J. Finney, and D. Li, “Identifying PV Module Mismatch Faults by a Distribution Analysis,” IEEE Transactions on device and materialsrials reliability, vol. 14, no. 4, pp. 951–960, 2014. [7] A. Chikh and A. Chandra, “An Optimal Maximum Power Point Tracking Algorithm for PV Systems with Estimation,” IEEE Transactions on Sustainable Energy, vol. 6, no. 2, pp. 644–652, 2015. Climatic Parameters [8] M. Hejri and H. Mokhtari, “On the Comprehensive Parametrization Photovoltaic (PV) Cells and Modules,” IEEE Journal of Photovoltaics, vol. 7, no. 1, pp. 250– 258, 2017. of the 671 IJTSRD | May-Jun 2017 Available Online @www.ijtsrd.com