Download
1 / 37
370 likes | 678 Vues
Presentation and Analysis of a Multi-Dimensional Interpolation Function for Non-Uniform Data: Microsphere Projection. Presented By: Will Dudziak. What We Will Cover…. Introduce Interpolation Overview of Existing Techniques Introduce Microsphere Projection Analysis of Results 1D 2D 3D

E N D
Presentation and Analysis of a Multi-Dimensional Interpolation Function for Non-Uniform Data: Microsphere Projection Presented By:Will Dudziak
What We Will Cover… • Introduce Interpolation • Overview of Existing Techniques • Introduce Microsphere Projection • Analysis of Results • 1D • 2D • 3D • Conclusion and Final Remarks • Q & A Hand with Reflecting Sphere M. C. Escher, 1935
Introduction – What is Interpolation? • “the process of determining the value of a function between two points at which it has prescribed values.” • The hill behind me is low, the mountain in front of me is high… therefore I must be somewhere in between low and high.
Introduction – Some Terminology • “Control Points” or “Sample Points” • Differentiable • C0,C1,C2, etc. • Functional Interpolation • Inverse-Distance p-value • Monotonic Behavior
Introduction – Local vs. Global Interpolation • Local Interpolation • Makes use of information from small set of ‘local’ points. • Global Interpolation • Makes use of information from all points • Key Difference: • Local interpolation applies different set of rules to close sample points than to far ones. vs.
Introduction – Exact vs. Inexact Interpolation • Exact interpolations intersect ALL control points. • Inexact interpolations follow general trends. • Usages: • Exact: Largest problem with data is in scarcity of control points. • Inexact: Largest problem with data is in error margin of sampled value.
Popular Existing Interpolation Methods • 1D • Polynomial Function Approximation • Piecewise Cubic Spline • 2D • Thin-Plate Spline (TPS) • 3D • Volume Spline • Multiquadric • 1D, 2D, 3D • Nearest Neighbor • Shepard’s Method (inverse-distance weighting)
Popular Existing Interpolation Methods (1-D) Polynomial Function Interpolation Cubic Spline Interpolation
Radial Basis Function • Radial Basis Function • Premise: • Interpolation in N-dimensional space can be approximated by a function of form: • A*f(d1) + B*f(d2) + C*f(d3) + … + Z*f(dN) • ABC…Z are constants • di is the distance from interpolation location to control point i. • Time Complexity: O(N2) • TPS, Volume Spline, and Multiquadric use RBF.
Shepard‘s Method • Shepard’s Method, aka Inverse-distance Weighting. • Assign weights to each control point based on distance to interpolation location. • Based on weight distribution, interpolate value of point. Fundamental Problem with Shepard’s Method is the non-consideration of locality.
Microsphere Projection - Objectives • Obeys Maximum Principle • Differentiable (smooth) • Non-consideration of redundant control points. (problem with Shepard’s method) • Reasonable extrapolation ability
Microsphere Projection - Premise • infinitesimally small sphere located at the point of interpolation. • sphere is ‘illuminated’ by the surrounding sampled points. • Based on the degree of illumination, a weight for all the control points assigned.
MS – Data Structure • 1x Microsphere • 2000x Sphere Segment • 1x Index of control point with largest influence (int) • 1x Projection influence (double) “Data Structure” not to be confused with “Data’s Structure”.
MS – Creating the Sphere • Sphere needs lots of sections to be ‘spherical’. • 2000 sections were used. • Section unit vectorswere created by: do x := rand(-1,1) y := rand(-1,1) z := rand(-1,1) vectorSize := sqrt (x*x + y*y + z*z) while ( vectorSize > 1 ) normalize ( Vector(x,y,z) )
MS – Control Point Projection • Points are ‘projected’ on to the sphere. • Projection intensity varies: • Inversely as the distance. • Inversely as the angle of incidence. (governed by the cosine function) • Each section of the sphere only retains the information for the ONE POINT with largest projection value.
MS – Control Point Projection Intensity Projection Function: for i := 0 to Number of Samples vector1 := sample[i].XYZLocation - interpolant.XYZLocation weight := pow(vector1.Size, -p) for j := 0 to Precision cosValue := CosValueBetweenVectors(vector1, S[j].Vector) if (cosValue * weight > S[j].Max_Illumination) S[j].Max_Illumination := cosValue * weight S[j].Brightest_Sample := i endif endfor endfor
MS – Determining Final Interpolation Value • Weight for each control point is assigned based on total sum of illumination on all the sections of the sphere. • Weights are normalized such that Sum(weights) = 1. • Final interpolation is: Σ(weight*control_point_value)
MS – Walkthrough [cos(θ) / dist2] 10dB 0.190.550.830.980.980.830.550.240.240.550.830.980.980.830.550.19 40dB Dist = 1 5dB Dist = 2 0.48 * 10dB 0.48 4.91 0.04 * 40dB 0.04 0.48 0.48 * 5dB 0.48 4.91 8.8dB 1.00 10.30
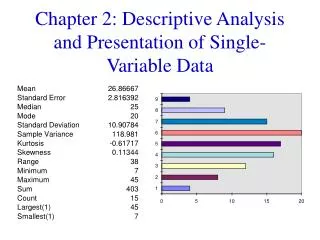
1-D Results – Numeric RMS Error using Strict Interpolation on 1D Data
1-D Results – Numeric RMS Error using General Interpolation on 1D Data
1-D Results – PCS Explanation In some cases, even asking for a small amount of extrapolation can be too much to ask.
2-D Results – Case Study 1 Original TPS NearestNeighbor MS, p=1 Shepard’s Method MS, p=2
2-D Results – Case Study 1 TPS,Values truncated to 0-255 TPS,Areas interpolated beyond data range in red.
2-D Results – Case Study 2 (Area of Interest) NN MS, p=1 TPS MS, p=2
3-D Results – Case Study Nearest Neighbor Shepard’s Method
3-D Results – Case Study Multiquadric Volume Spline
3-D Results – Case Study Microsphere Interpolation, p=2
Hyper-Dimensional Interpolation • Microsphere Projection will work in any Cartesian coordinate system. Rotating Hypersphere. Oooooh, Aaaaah.
Convex Hull Bounding Box Hyper-Dimensional Interpolation • As dimensionality increases, bounding box becomes much larger than convex hull. • Greater need for algorithms which can both interpolate and extrapolate. bbd is the d-dimensional bounding boxchd is the d-dimensional convex hull║x║ is the volume of space enclosed by x
Conclusion • Great interpolation ability • Pretty good (and stable) extrapolation ability. • Differentiable • Preserves monotonic behavior • Works well in any dimension • Based on a simple physicalmodel Buckminsterfullerene. Perhaps the smallest real-world microsphere possible, measuring around 0.000000001 meters.