Download

1 / 12
120 likes | 214 Vues
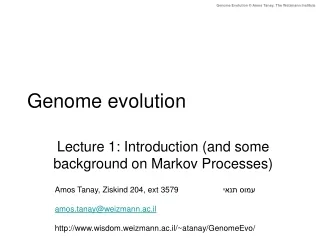
Figures Only, Tables will be in the manuscript word file. Fungal Genome Size and Intron Evolution. Kemin Zhou, Oct 4, 2012. 400. 100. Batde5. ustma1. 350. 300. 80. 250. 200. 60. Sporo1. 150. 100. 40. 50. 0. 20. 40. 60. 80. 100. 0. 20. 40. 60. 80. 100. 0. 20. 40. 60.

E N D
Figures Only, Tables will be in the manuscript word file Fungal Genome Size and Intron Evolution Kemin Zhou, Oct 4, 2012
400 100 Batde5 ustma1 350 300 80 250 200 60 Sporo1 150 100 40 50 0 20 40 60 80 100 0 20 40 60 80 100 0 20 40 60 80 100 0 20 40 400 300 Aspni1 250 Mycgr1 Mycfi1 Necha2 500 250 300 200 400 200 200 300 150 150 100 200 100 100 350 70 Picst3 Trire2 copci1 400 Trive1 700 50 250 300 500 30 150 200 300 10 50 100 Count Lacbi1 Phchr1 1000 400 500 500 300 800 400 400 300 200 300 600 cryneo1 Pospl1 200 100 200 400 800 Phybl1 600 400 200 60 80 100 Percent Relative Intron Location from 5’-End of mRNA Fig 1.
RIL Exon Length IPG Fig 2.
C. A. Number of RT Events B. D. -0.13 Ln (Number of RT Events) Fig 3.
8 7.66 y = 61.94x – 23.313 p-value = 2.566E-07 Sporo1 7 6 cryneo1 Pospl1 Phchr1 Lacbi1 Phybl1 copci1 5 Mean Number of Coding Exons per Gene 4 Batde5 Aspni1 Necha2 3 Trive1 Trire2 Mycgr1 Mycfi1 2 ustma1 Picst3 1 0.40 0.42 0.44 0.46 0.48 0.50 Mean Relative Intron Location Fig 4.
Number of RTF Fig 5.
Sporo1 7 cryneo1 Intercept: 9.69 ± 1.99 Slope: -0.30 ± 0.16 Pospl1 6 Lacbi1 copci1 Phchr1 5 Phybl1 Batde5 Average EPG 4 Intercept: 4.04 ± 0.35 Slope: -0.11 ± 0.03 Aspni1 Trire2 Necha2 3 Mycgr1 Trive1 Mycfi1 2 ustma1 Picst3 9 10 11 12 13 14 ln (Total RTF Length (nt)) Fig 6.
A. Fungi B. C. reinhardtii 75 Exon Length (nt) Fig 7.
1000 600 200 0 Average Exon Length (nt) 0 10 20 30 40 50 60 70 Number of Introns per Gene Fig 8.
1.204E-07 1.482E-18 2.228E-10 1.390E-25 0.04 0.00 Aspni1 Mycfi1 Mycgr1 Necha2 -0.04 1.303E-03 1.397E-35 5.121E-18 4.021E-08 0.04 0.00 copci1 Picst3 Trive1 Trire2 -0.04 Difference of frequency (non-conserved - conserved) 5.447E-01 1.770E-35 1.330E-01 4.135E-02 0.04 0.00 cryneo1 Pospl1 Lacbi1 Phchr1 -0.04 8.968E-02 2.997E-03 8.028E-11 1.047E-22 0.04 0.00 Sporo1 Phybl1 ustma1 Batde5 -0.04 0 20 40 60 80 0 20 40 60 80 0 20 40 60 80 0 20 40 60 80 Percent relative intron location from 5’-end of mRNA Fig 9.
8 A. all between phyla 6 phylum species 4 EPG 2 0 7 B. 6 5 4 EPG per 400 aa 3 2 1 0 Trire2 Picst3 Pospl1 Phybl1 Trive1 Lacbi1 copci1 ustma1 Mycfi1 Sporo1 Phchr1 Batde5 Mycgr1 Necha2 Aspni1 cryneo1 Fig 10.
2 3 4 5 6 7 8 7 Sporo1 y = 0.503 x + 1.172 Excluding Sporo1, p-val=8.196E-07 6 Pospl1 cryneo1 5 Lacbi1 EPG of Species-specific Genes Phybl1 copci1 Phchr1 4 Batde5 Necha2 Trire2 3 Mycgr1 Aspni1 Trive1 Mycfi1 2 ustma1 Picst3 EPG of Genes Conserved in All Species Fig 11.