Download
1 / 21
300 likes | 500 Vues
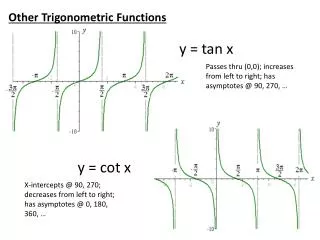
Lesson 47 – Trigonometric Functions & Periodic Phenomenon. IB Math SL1 - Santowski. Lesson Objectives. 1. Relate the features of sinusoidal curves to modeling periodic phenomenon 2. Transformations of sinusoidal functions and their features. (A) Key Terms.

E N D
Lesson 47 – Trigonometric Functions & Periodic Phenomenon IB Math SL1 - Santowski IB Math SL1 - Santowski
Lesson Objectives • 1. Relate the features of sinusoidal curves to modeling periodic phenomenon • 2. Transformations of sinusoidal functions and their features IB Math SL1 - Santowski
(A) Key Terms • Define the following key terms that relate to trigonometric functions: • (a) period • (b) amplitude • (c) axis of the curve (or equilibrium axis) IB Math SL1 - Santowski
(A) Key Terms IB Math SL1 - Santowski
The General Sinusoidal Equation • In the equation f(x) = asin(k(x+c)) + d, explain what: • a represents? • k represents? • c represents? • d represents? IB Math SL1 - Santowski
(A) Fast Five • The graph shows John’s height above the ground as a function of time as he rides a Ferris wheel. • (a) State the maximum and minimum height of the ride. • (b) How long does the Ferris wheel take to make one complete revolution? • (c) What is the amplitude of the curve? How does this relate to the Ferris wheel? • (d) Determine the equation of the axis of the curve. IB Math SL1 - Santowski
(C) Modeling Periodic Phenomenon & Transformed Sinusoidal Curves IB Math SL1 - Santowski
(C) Modeling Periodic Phenomenon & Transformed Sinusoidal Curves IB Math SL1 - Santowski
(C) Modeling Periodic Phenomenon & Transformed Sinusoidal Curves IB Math SL1 - Santowski
(C) Modeling Periodic Phenomenon & Transformed Sinusoidal Curves IB Math SL1 - Santowski
(C) Modeling Periodic Phenomenon & Transformed Sinusoidal Curves IB Math SL1 - Santowski
(C) Modeling Periodic Phenomenon & Transformed Sinusoidal Curves • A spring bounces up and down according to the model d(t) = 0.5 cos 2t, where d is the displacement in centimetres from the rest position and t is the time in seconds. The model does not consider the effects of gravity. • (a) Make a table for 0 ≤ t ≤ 9, using 0.5-s intervals. • (b) Draw the graph. • (c) Explain why the function models periodic behaviour. • (d) What is the relationship between the amplitude of the function and the displacement of the spring from its rest position? • (e) What is the period and what does it represent in the context of this question? • (f) What is the amplitude and what does it represent in the context of this question? IB Math SL1 - Santowski
(C) Modeling Periodic Phenomenon & Transformed Sinusoidal Curves IB Math SL1 - Santowski
(C) Modeling Periodic Phenomenon & Transformed Sinusoidal Curves • 1. Draw and label a scatter plot of the data. Then draw the curve of best fit. • 2. (a) Starting with day 1, how many days does it take for the shortest complete pattern of the graph to repeat? • (b) Starting with day 6, how many days does the graph take to repeat? • (c) On what other day could the graph begin and still repeat? • 3. (a) Extend the pattern of the graph to include the 95th day of the new millennium. Was the phase of the moon closer to a full moon or a new moon? Explain. • (b) Extend the graph to predict the fraction of the moon that was visible on the summer solstice, June 21. Was the moon waxing or waning? Explain. IB Math SL1 - Santowski
(C) Modeling Periodic Phenomenon & Transformed Sinusoidal Curves • You found that this data represents a periodic phenomenon with the following properties: • The period is about 29.5 days. • The “full” moon is fully visible when the maximum value is 1.0. • The “new” moon is not visible when the minimum value is 0. • The axis of the curve is the horizontal line y 0.5. • The amplitude of the curve is 0.5. • You know that a sinusoidal model of this data is: • f(x) = asin(k(x+c)) + d IB Math SL1 - Santowski
(E) Combining Transformations • We continue our investigation by graphing some other functions in which we have combined our transformations • (i) Graph and analyze y = 2 sin 3(x - 60°) + 1 identify transformations and state how the key features have changed • (ii) Graph and analyze y = 2 cos [2(x - /4)] – 3 identify transformations and state how the key features have changed • (iii) Graph and analyze y = tan( ½ x + /4) – 3 identify transformations and state how the key features have changed IB Math SL1 - Santowski
(B) Writing Sinusoidal Equations • ex 1. Given the equation y = 2sin3(x - 60°) + 1, determine the new amplitude, period, phase shift and equation of the axis of the curve. • Amplitude is obviously 2 • Period is 2/3 or 360°/3 = 120° • The equation of the equilibrium axis is y = 1 • The phase shift is 60° to the right IB Math SL1 - Santowski
(B) Writing Sinusoidal Equations • ex 2. Given a cosine curve with an amplitude of 2, a period of 180°, an equilibrium axis at y = -3 and a phase shift of 45° right, write its equation. • So the equation is y = 2 cos [2(x - 45°)] – 3 • Recall that the k value is determined by the equation period = 2/k or k = 2/period • If working in degrees, the equation is modified to period = 360°/k or k = 360°/period IB Math SL1 - Santowski
(C) Writing Sinusoidal Equations from Word Problems • Now we shift to word problems wherein we must carry out the same skills in order to generate an equation for the sinusoidal curve that best models the situation being presented. • ex 5. A small windmill has its center 6 m above the ground and the blades are 2 m in length. In a steady wind, one blade makes a rotation in 12 sec. Use the point P as a reference point on a blade that started at the highest point above the ground. • (a) Determine an equation of the function that relates the height of a tip of a blade, h in meters, above the ground at a time t. • (b) What is the height of the point P at the tip of a blade at 5s? 40s? • (c) At what time is the point P exactly 7 m above the ground? IB Math SL1 - Santowski
(C) Writing Sinusoidal Equations from Word Problems • ex 6. In the Bay of Fundy, the depth of water around a dock changes from low tide around 03:00 to high tide at 09:00. The data shown below shows the water depth in a 24 hour period • (a) Prepare a scatter plot of the data and draw the curve of best fit • (b) Determine an equation of the curve of best fit • (c) You can enter the data into a GC and do a SinReg to determine the curve of best fit • (d) Compare your equation to the calculator=s equation. • (e) Will it be safe for a boat to enter the harbour between 15:00 and 16:00 if it requires at least 3.5 m of water? Explain and confirm will algebraic calculation. IB Math SL1 - Santowski
(D) Homework • Nelson text, page 464, Q8,9,10,12,13-19 IB Math SL1 - Santowski