Download
1 / 1
10 likes | 111 Vues
1.5 cm. C16 : 1 cis11 content. Spore density. 20.0. 1.5. 0 - 10cm. 35. 35. -. -. 50cm. 50cm. R=0.917*. 16.0. 1.0. 10 - 20cm. Wheat. 10. 10. -. -. 20cm. 20cm. 12.0. 0.5. Fallow. 0. 0. -. -. 10cm. 10cm. AMF spore density (/dry soil g). 20 - 35cm. 0. -. 10cm. 0.

E N D
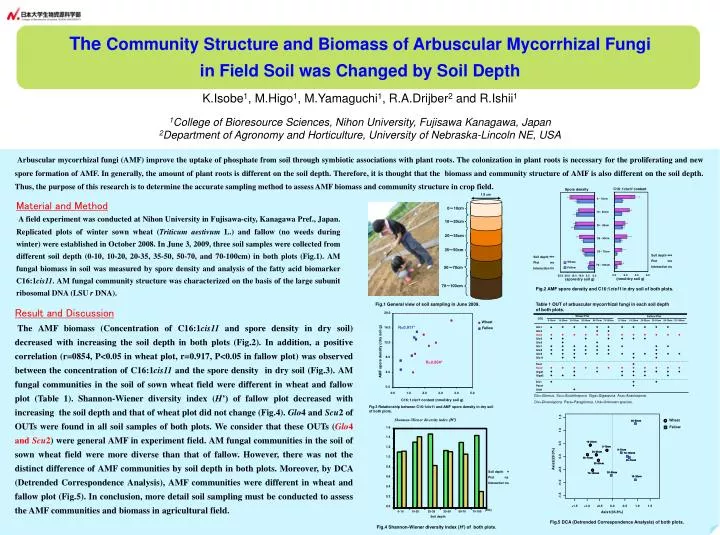
1.5 cm C16:1cis11 content Spore density 20.0 1.5 0 - 10cm 35 35 - - 50cm 50cm R=0.917* 16.0 1.0 10 - 20cm Wheat 10 10 - - 20cm 20cm 12.0 0.5 Fallow 0 0 - - 10cm 10cm AMF spore density (/dry soil g) 20 - 35cm 0 - 10cm 0 - 10cm 20 20 - - 35cm 35cm 70 70 - - 100cm 100cm Wheat 0.0 8.0 50 50 - - 70cm 70cm Axis2(29.0%) Fallow 50 50 - - 70cm 70cm R=0.854* 35 35 - - 50cm 50cm 35 - 50cm 0 - 10 0.5 Shannon-Wienerdiversity index(H’) - - - 20 20 - - 35cm 35cm 4.0 70 70 - - 100cm 100cm 10 10 - - 20cm 20cm 1.6 50 - 70cm 1.0 Soil depth Plot Interaction *** *** ns 1.4 *** ns ns Soil depht Plot Interaction - - - 0.0 1.2 0.0 1.0 2.0 70 - 100cm 3.0 4.0 5.0 1.5 - 1.0 C16:1cis11 content (nmol/dry soil g) 25.0 20.0 15.0 10.0 5.0 0.0 0.8 - - - 1.5 - - - 1.0 - - - 0.5 0.0 0.5 1.0 1.5 Soil depth * Plotns Interaction ns 0.0 2.0 4.0 6.0 (nmol/dry soil g) (spore/dry soil g) Axis1(36.8%) 0.6 0.4 0.2 0.0 (cm) 10-20 20-35 35-50 50-70 70-100 Soil depth Fig.2 AMF spore density and C16:1cis11 in dry soil of both plots. Table 1 OUT of arbuscular mycorrhizal fungi in each soil depth of both plots. Wheat Plot Fallow Plot OTU 0-10cm 10-20cm 20-35cm 35-50cm 50-70cm 70-100cm 0-10cm 10-20cm 20-35cm 35-50cm 50-70cm 70-100cm Glo1 ◆ ◆ ◆ ◆ ◆ ◆ ◆ ◆ ◆ ◆ ◆ Glo3 ◆ ◆ Glo4 ◆ ◆ ◆ ◆ ◆ ◆ ◆ ◆ ◆ ◆ ◆ ◆ Glo5 ◆ ◆ ◆ ◆ ◆ ◆ ◆ Glo6 ◆ ◆ Glo7 ◆ ◆ ◆ ◆ ◆ ◆ ◆ ◆ ◆ Glo8 ◆ ◆ ◆ ◆ ◆ ◆ ◆ Glo9 ◆ ◆ ◆ ◆ ◆ ◆ ◆ ◆ ◆ ◆ ◆ ◆ Glo11 ◆ ◆ ◆ ◆ Scu1 ◆ Scu2 ◆ ◆ ◆ ◆ ◆ ◆ ◆ ◆ ◆ ◆ ◆ ◆ Giga1 ◆ ◆ ◆ ◆ ◆ ◆ ◆ ◆ ◆ Giga2 ◆ ◆ ◆ ◆ ◆ ◆ ◆ Div1 ◆ ◆ ◆ Para1 ◆ Unk1 ◆ Glo=Glomus,Scu=Scutellospora,Giga=Gigaspora,Aca=Acaulospora, Div=Diversispora,Para=Paraglomus,Unk=Unknown species. Fig.4 Shannon-Wiener diversity index (H’) of both plots. Fig.5 DCA (Detrended Correspondence Analysis) of both plots. 0~10cm Wheat The Community Structure and Biomass of Arbuscular Mycorrhizal Fungi in Field Soil was Changed by Soil Depth K.Isobe1, M.Higo1, M.Yamaguchi1, R.A.Drijber2 and R.Ishii1 1College of Bioresource Sciences, Nihon University, Fujisawa Kanagawa, Japan 2Department of Agronomy and Horticulture, University of Nebraska-Lincoln NE, USA Fallow 10~20cm 20~35cm 35~50cm 50~70cm 70~100cm Arbuscular mycorrhizal fungi (AMF) improve the uptake of phosphate from soil through symbiotic associations with plant roots. The colonization in plant roots is necessary for the proliferating and new spore formation of AMF. In generally, the amount of plant roots is different on the soil depth. Therefore, it is thought that the biomass and community structure of AMF is also different on the soil depth. Thus, the purpose of this research is to determine the accurate sampling method to assess AMF biomass and community structure in crop field. Material and Method A field experiment was conducted at Nihon University in Fujisawa-city, Kanagawa Pref., Japan. Replicated plots of winter sown wheat (Triticum aestivum L.) and fallow (no weeds during winter) were established in October 2008. In June 3, 2009, three soil samples were collected from different soil depth (0-10, 10-20, 20-35, 35-50, 50-70, and 70-100cm) in both plots (Fig.1). AM fungal biomass in soil was measured by spore density and analysis of the fatty acid biomarker C16:1cis11. AM fungal community structure was characterized on the basis of the large subunit ribosomal DNA (LSU r DNA). Fig.1 General view of soil sampling in June 2009. Result and Discussion The AMF biomass (Concentration of C16:1cis11 and spore density in dry soil) decreased with increasing the soil depth in both plots (Fig.2). In addition, a positive correlation (r=0854, P<0.05 in wheat plot, r=0.917, P<0.05 in fallow plot) was observed between the concentration of C16:1cis11 and the spore density in dry soil (Fig.3). AM fungal communities in the soil of sown wheat field were different in wheat and fallow plot (Table 1). Shannon-Wiener diversity index (H’) of fallow plot decreased with increasing the soil depth and that of wheat plot did not change (Fig.4). Glo4 and Scu2 of OUTs were found in all soil samples of both plots. We consider that these OUTs (Glo4 and Scu2) were general AMF in experiment field. AM fungal communities in the soil of sown wheat field were more diverse than that of fallow. However, there was not the distinct difference of AMF communities by soil depth in both plots. Moreover, by DCA (Detrended Correspondence Analysis), AMF communities were different in wheat and fallow plot (Fig.5). In conclusion, more detail soil sampling must be conducted to assess the AMF communities and biomass in agricultural field. Fig.3 Relationship between C16:1cis11 and AMF spore density in dry soil of both plots.