Download
1 / 1
10 likes | 105 Vues
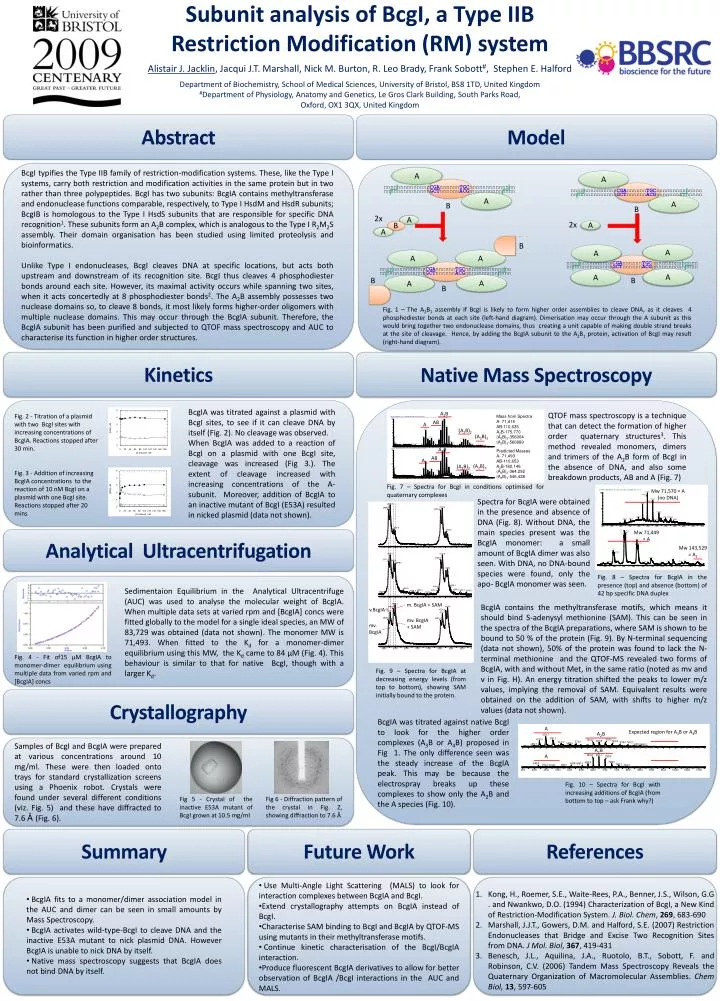
Subunit analysis of BcgI, a Type IIB Restriction Modification (RM) system Alistair J. Jacklin , Jacqui J.T. Marshall, Nick M. Burton, R. Leo Brady, Frank Sobott # , Stephen E. Halford Department of Biochemistry, School of Medical Sciences, University of Bristol, BS8 1TD, United Kingdom

E N D
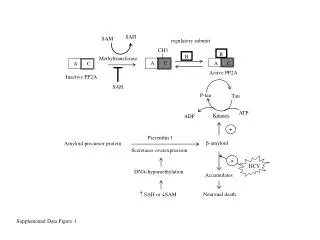
Subunit analysis of BcgI, a Type IIB Restriction Modification (RM) system Alistair J. Jacklin, Jacqui J.T. Marshall, Nick M. Burton, R. Leo Brady, Frank Sobott#, Stephen E. Halford Department of Biochemistry, School of Medical Sciences, University of Bristol, BS8 1TD, United Kingdom #Department of Physiology, Anatomy and Genetics, Le Gros Clark Building, South Parks Road, Oxford, OX1 3QX, United Kingdom Abstract Model BcgI typifies the Type IIB family of restriction-modification systems. These, like the Type I systems, carry both restriction and modification activities in the same protein but in two rather than three polypeptides. BcgI has two subunits: BcgIA contains methyltransferase and endonuclease functions comparable, respectively, to Type I HsdM and HsdR subunits; BcgIB is homologous to the Type I HsdS subunits that are responsible for specific DNA recognition1. These subunits form an A2B complex, which is analogous to the Type I R2M2S assembly. Their domain organisation has been studied using limited proteolysis and bioinformatics. Unlike Type I endonucleases, BcgI cleaves DNA at specific locations, but acts both upstream and downstream of its recognition site. BcgI thus cleaves 4 phosphodiester bonds around each site. However, its maximal activity occurs while spanning two sites, when it acts concertedly at 8 phosphodiester bonds2. The A2B assembly possesses two nuclease domains so, to cleave 8 bonds, it most likely forms higher-order oligomers with multiple nuclease domains. This may occur through the BcgIA subunit. Therefore, the BcgIA subunit has been purified and subjected to QTOF mass spectroscopy and AUC to characterise its function in higher order structures. A A nnnnnnnnnnnnnnCGAnnnnnnTGCnnnnnnnnnnnnnn nnnnnnnnnnnnnnGCTnnnnnnACGnnnnnnnnnnnnnn nnnnnnnnnnnnnnCGAnnnnnnTGCnnnnnnnnnnnnnnnnnnnnnnnnnnnnGCTnnnnnnACGnnnnnnnnnnnnnn A A A2B B B AB A 2x (A2B)2 A 2x B (A2B)3 A A A2B B AB A A A (A2B)3 A A (A2B)2 nnnnnnnnnnnnnnCGAnnnnnnTGCnnnnnnnnnnnnnnnnnnnnnnnnnnnnGCTnnnnnnACGnnnnnnnnnnnnnn nnnnnnnnnnnnnnCGAnnnnnnTGCnnnnnnnnnnnnnn nnnnnnnnnnnnnnGCTnnnnnnACGnnnnnnnnnnnnnn A A B B A A B Fig. 1 – The A2B1 assembly if BcgI is likely to form higher order assemblies to cleave DNA, as it cleaves 4 phosphodiester bonds at each site (left-hand diagram). Dimerisation may occur through the A subunit as this would bring together two endonuclease domains, thus creating a unit capable of making double strand breaks at the site of cleavage. Hence, by adding the BcgIA subunit to the A2B1 protein, activation of BcgI may result (right-hand diagram). Kinetics Native Mass Spectroscopy A A2B A2B A BcgIA was titrated against a plasmid with BcgI sites, to see if it can cleave DNA by itself (Fig. 2). No cleavage was observed. When BcgIA was added to a reaction of BcgI on a plasmid with one BcgI site, cleavage was increased (Fig 3.). The extent of cleavage increased with increasing concentrations of the A-subunit. Moreover, addition of BcgIA to an inactive mutant of BcgI (E53A) resulted in nicked plasmid (data not shown). QTOF mass spectroscopy is a technique that can detect the formation of higher order quaternary structures3. This method revealed monomers, dimers and trimers of the A2B form of BcgI in the absence of DNA, and also some breakdown products, AB and A (Fig. 7) Fig. 2 - Titration of a plasmid with two BcgI sites with increasing concentrations of BcgIA. Reactions stopped after 30 min. Mass from Spectra A- 71,415 AB-110,635A2B-175,770 (A2B)2-356064 (A2B)3-560889 Predicted Masses A- 71,493 AB-110,653A2B-182,146 (A2B)2-364,292 (A2B)3-546,438 Fig. 3 - Addition of increasing BcgIA concentrations to the reaction of 10 nM BcgI on a plasmid with one BcgI site. Reactions stopped after 20 mins Fig. 7 – Spectra for BcgI in conditions optimised for quaternary complexes Mw 71,570 = A (no DNA) Spectra for BcgIA were obtained in the presence and absence of DNA (Fig. 8). Without DNA, the main species present was the BcgIA monomer: a small amount of BcgIA dimer was also seen. With DNA, no DNA-bound species were found, only the apo- BcgIA monomer was seen. m. BcgIA + SAM v.BcgIA mv. BcgIA + SAM mv. BcgIA Mw 71,449 = A Analytical Ultracentrifugation Mw 143,529 = A2 Fig. 8 – Spectra for BcgIA in the presence (top) and absence (bottom) of 42 bpspecific DNA duplex Sedimentaion Equilibrium in the Analytical Ultracentrifuge (AUC) was used to analyse the molecular weight of BcgIA. When multiple data sets at varied rpm and [BcgIA] concswere fitted globally to the model for a single ideal species, an MW of 83,729 was obtained (data not shown). The monomer MW is 71,493. When fitted to the Kd for a monomer-dimer equilibrium using this MW, the Kd came to 84 μM (Fig. 4). This behaviour is similar to that for native BcgI, though with a larger Kd. BcgIA contains the methyltransferase motifs, which means it should bind S-adenysylmethionine (SAM). This can be seen in the spectra of the BcgIA preparations, where SAM is shown to be bound to 50 % of the protein (Fig. 9). By N-terminal sequencing (data not shown), 50% of the protein was found to lack the N-terminal methionine and the QTOF-MS revealed two forms of BcgIA, with and without Met, in the same ratio (noted as mvand v in Fig. H).An energy titration shifted the peaks to lower m/z values, implying the removal of SAM. Equivalent results were obtained on the addition of SAM, with shifts to higher m/z values (data not shown). Fig. 4 - Fit of15 μM BcgIA to monomer-dimer equilibrium using multiple data from varied rpm and [BcgIA] concs Fig. 9 – Spectra for BcgIA at decreasing energy levels (from top to bottom), showing SAM initially bound to the protein. Crystallography BcgIA was titrated against native BcgI to look for the higher order complexes (A3B or A4B) proposed in Fig 1. The only difference seen was the steady increase of the BcgIA peak. This may be because the electrospray breaks up these complexes to show only the A2B and the A species (Fig. 10). Expected region for A3B or A4B Samples of BcgI and BcgIA were prepared at various concentrations around 10 mg/ml. These were then loaded onto trays for standard crystallization screens using a Phoenix robot. Crystals were found under several different conditions (viz. Fig. 5) and these have diffracted to 7.6 Å (Fig. 6). Fig. 10 – Spectra for BcgI with increasing additions of BcgIA (from bottom to top – ask Frank why?) Fig 5 - Crystal of the inactive E53A mutant of BcgI grown at 10.5 mg/ml Fig 6 - Diffraction pattern of the crystal in Fig. Z, showing diffraction to 7.6 Å Summary Future Work References • Use Multi-Angle Light Scattering (MALS) to look for interaction complexes between BcgIA and BcgI. • Extend crystallography attempts on BcgIA instead of BcgI. • Characterise SAM binding to BcgI and BcgIA by QTOF-MS using mutants in their methyltransferase motifs. • Continue kinetic characterisation of the BcgI/BcgIA interaction. • Produce fluorescent BcgIA derivatives to allow for better observation of BcgIA /BcgI interactions in the AUC and MALS. Kong, H., Roemer, S.E., Waite-Rees, P.A., Benner, J.S., Wilson, G.G . and Nwankwo, D.O. (1994) Characterization of BcgI, a New Kind of Restriction-Modification System. J. Biol. Chem, 269, 683-690 Marshall, J.J.T., Gowers, D.M. and Halford, S.E. (2007) Restriction Endonucleases that Bridge and Excise Two Recognition Sites from DNA. J Mol. Biol, 367, 419-431 Benesch, J.L., Aquilina, J.A., Ruotolo, B.T., Sobott, F. and Robinson, C.V. (2006) Tandem Mass Spectroscopy Reveals the Quaternary Organization of Macromolecular Assemblies. ChemBiol, 13, 597-605 • BcgIA fits to a monomer/dimer association model in the AUC and dimer can be seen in small amounts by Mass Spectroscopy. • BcgIA activates wild-type-BcgI to cleave DNA and the inactive E53A mutant to nick plasmid DNA. However BcgIA is unable to nick DNA by itself. • Native mass spectroscopy suggests that BcgIA does not bind DNA by itself.