Download
1 / 21
210 likes | 343 Vues
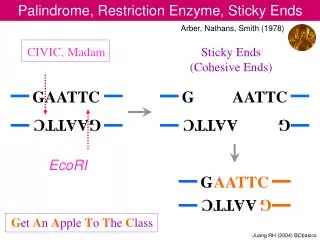
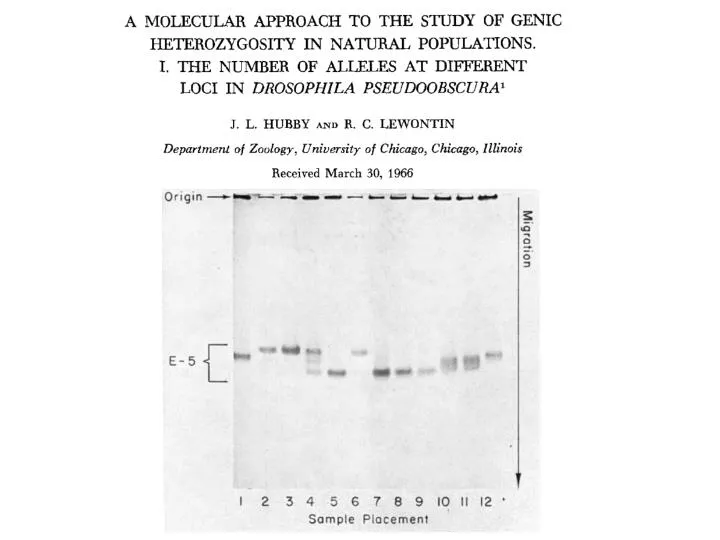
Restriction enzyme analysis. The new(ish) population genetics. Old view. New view. Allele frequency change looking forward in time; alleles either the same or different. Shape of gene tree looking backward in time; alleles are related phylogenetically. The first ‘gene tree’, 1979.

E N D
The new(ish) population genetics Old view New view Allele frequency change looking forward in time; alleles either the same or different Shape of gene tree looking backward in time; alleles are related phylogenetically
Diploid individuals Dissolved individuals
Wright, Kingman and the coalescent Sewell Wright J. F. C. Kingman Probability of common ancestry of two Randomly chosen alleles in previous generation
Probability that 10 sequences have j ancestors in previous generation
Probability that all k copies from a sample came from different copies in the preceding generation So, the time it takes for two copies from a sample to come from the same copy in the preceding generation is: (units in generations) And, the total time it takes for all copies from a sample to come from a common ancestral copy is: With large k 4N generations
Expected fixation time of neutral allele in population of size N(Kimura)
How to draw a coalescent tree Sample k copies from a population of 2N chromosomes Go back in time, drawing from an exponential distribution, with the average being 3. Combine two lineages 4. Decrease k by 1 5. If k-1, stop; otherwise, go back to step 1, using k-1 as a starting point
Estimating genetic diversity within populations • = 4Nm = average number of differences between two randomly sampled sequences from a population “Watterson’s theta” or q = observed number of differences between all pairs of sequences from a population. Also called “p”
Signatures of stable and expanding populations Short internal branches Long external branches Long internal branches Short external branches Expanding population Stable population Genetic diversity () or population size present past
Rapid spread of Mycoplasma in House Finch populations Courtesy Cornell Lab of Ornithology • Mycoplasma is transmitted horizontally, often at bird feeders • Expanded throughout the eastern US in just five years • Has now crossed the Rockies and is spreading south through California.
Numerous fixed SNP and indel differences, including CRISPR deletion Estimated mutation rate: ~9.3 x 10⁻¹⁰ per site per year; 24 homoplasious sites suggest recombination Estimated coalescence of chicken and finch strains, (611 yrs.) (95 % c.i. 484-753 yrs.) Serially-sampled phylogeny of 12 Mycoplasma strains 30 20 10 0 Years before present 743,011 aligned sites Phylogeny obtained using BEAST, strict clock, 10 million cycles, sampling every 1000 cycles
Interordinal molecular phylogeny of mammals Shape (node depths) of higher level trees depend on extrinsic factors