Download
1 / 23
230 likes | 350 Vues
Determining Peak Flows. Several Methods. Statistical Analysis of Streamflow Records Transfer Methods (using gaged data to estimate an ungaged location) Regional Methods (region-specific equations developed based on areas, slopes, etc) Models (Rational method/TR-55). Gaged Stations – New York.

E N D
Several Methods • Statistical Analysis of Streamflow Records • Transfer Methods (using gaged data to estimate an ungaged location) • Regional Methods (region-specific equations developed based on areas, slopes, etc) • Models (Rational method/TR-55)
Gaged Stations – New York • http://waterdata.usgs.gov/ny/nwis/rt
Objectives • Know the rational method equation • Know the assumptions used in developing the rational method • Know how to calculate peak flows using the rational method
Assumptions • Rainfall intensity is uniform over the drainage basin during the duration of the rainfall • Maximum runoff rate occurs when the rainfall lasts as long or longer than the time of concentration • The frequency for rainfall and runoff are equal
General Use • Rational method generally used for small drainage basins • Do not use the rational method for drainage areas larger than 100-200 acres • Rational method not applicable if there is significant ponding (ponds, wetlands) within the drainage area
Derivision • Assume a storm duration = time of conc. • Volume of runoff assuming no infiltration = avg. intensity*drainage area*storm duration =I*A*Tc
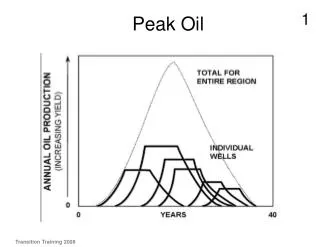
Theoretical runoff hydrograph Area under hydrograph = ½ *2Tc*Qp=Tc*Qp
Derivision of Rational Method • Volume of rain = Volume observed as Runoff • I*A*Tc=Tc*Qp • Qp=IA • To account for infiltration/evaporation/storage add a coefficient C (C<1) • Qp=CIA
Equation: Q=CIA • Q-peak flow (cfs) • C-runoff coefficient (dimensionless) • I-average rainfall intensity (in/hr) • A-drainage area basin (acres)
Do units make sense? acre-in/hr = cfs? Do the calculation: 1 acre-in/hr = 1.008 cfs
Basic Steps to Estimate Peak Flow Rational Method • Estimate time of concentration • Overland (sheet) flow • Shallow concentrated flow • Open channel flow • Choose a value of C • Select a frequency (return period) • Determine the average storm intensity from IDF Curve • Use rational method equation to estimate peak flow
C-Typical Values (by surface) Forested 0.059-0.2 Asphalt 0.7-0.95 Brick 0.7-0.85 Concrete 0.8-0.95 Shingle roof 0.75-0.95 Lawns, well drained (sandy soil) up to 2% slope 0.05-0.1 2% to 7% slopes 0.10-0.15 over 7% slope 0.15-0.2 Lawns, poor drainage (clay soil) up to 2% slope 0.13-0.17 2% to 7% slopes 0.18-0.22 over 7% slope 0.25-0.35 Driveways, walkways 0.75-0.85 Ref: Civil Engr. Ref. Manual, 6th ed., Michael Lindeburg, PE, Professional Publications, Inc. ISBN: 0-921045-45-0
C-Typical Values (by use) Farmland or Pasture 0.05-0.3 Unimproved 0.1-0.3 Parks or Cemeteries 0.1-0.25 Railroad Yard 0.2-0.4 Playgrounds (not asph or conc) 0.2-0.35 Business Districts neighborhood 0.5-0.7 city (downtown) 0.7-0.95 Residential single family 0.3-0.5 multi-plexes, detached 0.4-0.6 multi-plexes attached 0.6-0.75 suburban 0.25-0.40 apartments, condominiums 0.50-0.70 Industrial light 0.5-0.8 heavy 0.6-0.9 Ref: Civil Engr. Ref. Manual, 6th ed., Michael Lindeburg, PE, Professional Publications, Inc. ISBN: 0-921045-45-0
Rational Coefficient C Must be weighted if you have different area types within the drainage area Drainage area = 8 acres: 2 acres; C=0.35 (residential suburban) 6 acres; C=0.2 (undeveloped-unimproved) Weighted C=[(2)(.35)+(6)(.2)]/8 = 0.24
Example: Determine the peak flow for a 100-acre watershed in central NY (mostly forested). Assume the intensity is 3” per hour. What is the peak flow if the watershed is developed into light industrial usage? Assume the intensity is 3” per hour.
Example-undeveloped: C=0.13 (0.06+0.2)/2 I=3” per hour (given) A=100 acres Q=CIA = 39 cfs
Example-developed: C=0.65 (0.5+0.8)/2 I=3” per hour (given) A=100 acres Q=CIA = 195 cfs In reality, the peak could be higher, since the time of concentration would likely decrease (which would increase the intensity)
Detention Structures • Store runoff temporarily and then release it in a controlled manner to limit the peak flow leaving a site • Mitigates destructive effects of increased runoff • May improve water quality • May increase recharge
Detention Basin Examples • http://skagit.meas.ncsu.edu/~helena/wrriwork/cenntenial/photo.html • http://www.answers.com/topic/boneyard-creek • http://www.ems-i.com/wmshelp/QuickTour/Calculators/Detension_Basins/Detention_Basin_Analysis_Design-QT.htm
Detention Structures • Basically a tank or pond • Complex because water coming in (inflow hydrograph) is not constant • Water going out is not constant (single or multistaged outlet structure where Qout varies based on water elevation in the structure) • Water elevation in the structure is not constant
Midterm • Open book/open notes • You should be able to: • Delineate watershed areas • Read and interpret IDF curves • Interpret hydrographs (find watershed area, develop a unit hydrograph) • Calculate probabilities (for one year and over a time period)