Download
1 / 10
110 likes | 460 Vues
Pyramids. Pyramids of Giza. Pyramid of numbers. Pyramid of numbers. An ecological pyramid of numbers shows the population of each level in a food chain in a pictorial form. ….but…. Pyramid of numbers for a tree. …so we could use a pyramid of biomass. Pyramid of Biomass.

E N D
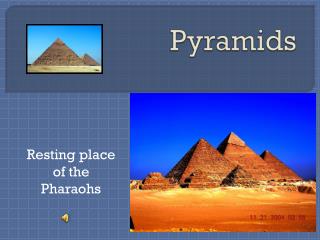
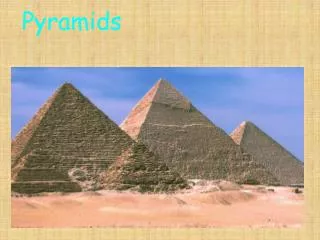
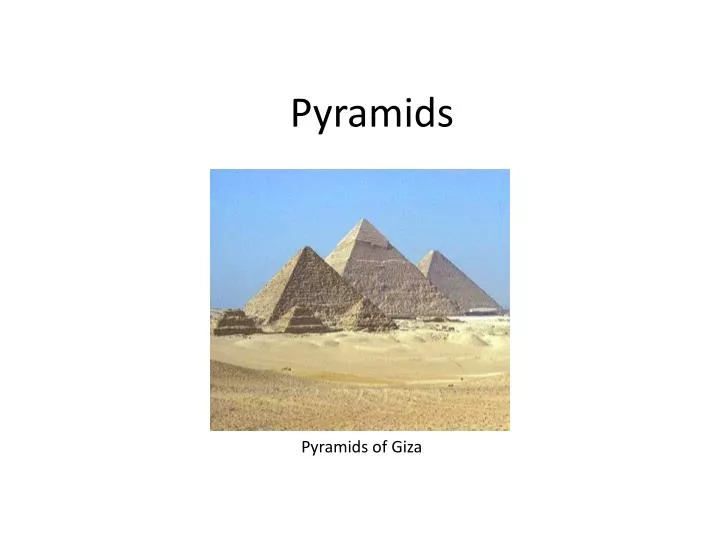
Pyramids Pyramids of Giza
Pyramid of numbers Pyramid of numbers An ecological pyramid of numbers shows the population of each level in a food chain in a pictorial form.
….but….. Pyramid of numbers for a tree
…so we could use a pyramid of biomass Pyramid of Biomass An ecological pyramid of biomass shows what happens to the amount of biomass at each trophic level by showing how much living material there is at each trophic level of a community at a specific time. Typical units for a biomass pyramid could be grams per meter2 (gm-2), or calories per meter2(cal m-2).
….but…… Dead bird Not every part of an organism is digestable, the beak and bones of a bird will not pass on to the next trophic level. This can make a pyramid of Biomass look like it contains more energy than it actually does.
…. So we could use a pyramid of productivity. An ecological pyramid of productivity is often more useful, showing the production or turnover of biomass at each trophic level. Instead of showing a single snapshot in time, productivity pyramids show the flow of energy through the food chain. Typical units would be grams per meter2per year (g m-2yr-1)or calories per meter2per year (cal m-2yr-1) As with the others, this graph begins with producers at the bottom and places higher trophic levels on top. (Wikipedia - http://en.wikipedia.org/wiki/Ecological_pyramid - 09.10 – 16th September 2010)
Bioaccumulation • Bioaccumulation refers to the build up of chemicals, such as pesticides in an organism. (USGS Toxic Substances Hydrology Program) Bioaccumulation occurs when an organism absorbs a toxic substance faster than it can lose it through egestion or excretion.
Bioaccumulation: increase in concentration of a pollutant from the environment to the first organism in a food chain • Biomagnification: increase in concentration of a pollutant from one link in a food chain to another. http://www.marietta.edu/~biol/102/2bioma95.html wwweb - 20thSeptember 2010, 13:10
Links • Classic example: DDT • Classic example: Minamata • Click on the hyperlinks and Read these articles!!!!!!
Images • Slide 1 - Pyramids of Giza – web - http://www.places-to-visit.us/files/images/The_Pyramids,_Giza,_Egypt_.png – 09.00, 16th September 2010. • Slide 2, 3 and 4 , - Pyramid of numbers; Pyramid of numbers for a tree; Pyramid of Biomass – http://media.tiscali.co.uk/images/feeds/hutchinson/ency/0013n049.jpg - 09.01, 16th September 2010. • Slide 4 – Dead Bird - Namb Faro, http://namb-ualg.blogspot.com/2009_04_01_archive.html - 09.01, 16th September 2010.