Download
1 / 44
440 likes | 859 Vues
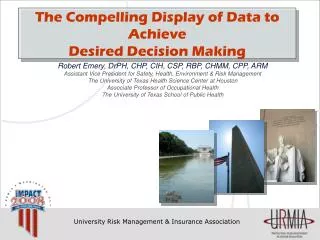
Part 2: The Compelling Display of Compliance Data. Robert Emery, DrPH, CHP, CIH, CSP, RBP, CHMM, CPP, ARM Assistant Vice President for Safety, Health, Environment & Risk Management The University of Texas Health Science Center at Houston Associate Professor of Occupational Health

E N D
Part 2:The Compelling Display of Compliance Data Robert Emery, DrPH, CHP, CIH, CSP, RBP, CHMM, CPP, ARM Assistant Vice President for Safety, Health, Environment & Risk Management The University of Texas Health Science Center at Houston Associate Professor of Occupational Health The University of Texas School of Public Health
Why a Supplemental Presentation on Data Display? • An interesting dilemma: • Compliance programs thrive on regulations, requirements, and data (what is the expectation and where do we stand?) • Virtually every important compliance decision is based on data to some extent • Formal training in the area of compelling data presentations is rare • The ability to compellingly display data is the key to desired decision making
Why Training on Data Presentation (cont.)? • The compliance profession is awash in bad examples of data presentations! • We’ve all endured them at some point in our careers! • Commentary: This could be a major contributing factor to the frustration associated with compliance program engagement.
Evolution of Compliance Measures and Metrics • First step: • ultimate outcomes – inspection non-compliance • Second step: • activities prior to first order events – audits, training sessions
Evolution of Compliance Measures and Metrics (cont.) • Third step: • Relating activities to larger institutional parameters – true metrics such as research expenditures, subcontract activities • Fourth step: • The compelling display of relationships so that the desired decision by upper management becomes obvious
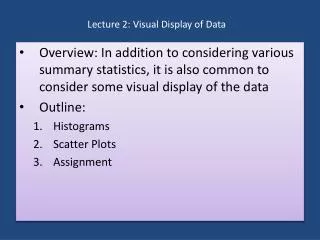
Achieving Compliance Data Display Excellence • The presentation of complex ideas and concepts in ways that are • Clear • Precise • Efficient • How do we go about achieving this?
Go to The Experts On Information Display • Three compelling books by Edward Tufte: • The Visual Display of Quantitative Information • How to depict data and enforce statistical honesty • Envisioning Information • Pictures of nouns • Visual Explanations • Pictures of verbs, cause and effect
Sample Recommendations • Do not blindly rely on the graphic formatting provided by Excel and PowerPoint • Present data that makes large data sets coherent • Encourage the eye to compare different data • Representations of numbers should be directly proportional to their numerical quantities • Use clear, detailed, and thorough labeling
Sample Recommendations (cont.) • Display data variation, not design variation • Maximize the data to ink ratio • When possible, use horizontal graphics: 50% wider than tall is usually best
Compelling Tufte Remark • Visual reasoning occurs more effectively when relevant information is shown adjacent in the space within our eye-span • This is especially true for statistical data where the fundamental analytical act is to make comparisons • The key point: “compared to what?”
“Make Over” Examples: First UTHSCH Data • Data we accumulated and displayed on: • Nuisance Fire Alarms • Workers compensation experience modifiers • First reports of injury • Corridor clearance • But first, 2 quick notes: • 1. The forum to be used: • The “big screen” versus the “small screen”? • In what setting are most important decisions made? • 2. Like fashion, there are likely no right answers – individual tastes apply - but some universal rules will become apparent
Results of the Great UTHSC-H Nuisance Fire Alarm Challenge (FY04) Fiscal Year 04
UT-Tyler UTMB UT-SA MDA UT-H UT-SW Employee Worker’s Comp Experience Modifiercompared to other UT health components, FY 98-FY 04 Rate of "1" industry average, representing $1 premium per $100
WCI Premium Adjustment for UTS Health Components(discount premium rating as compared to a baseline of 1) UT Health Center Tyler UT Medical Branch Galveston UT HSC San Antonio UT Southwestern Dallas UT HSC Houston UT MD Anderson Cancer Center Fiscal year
Employee Resident Student Losses – PersonnelReported Injuries by Population 694 715 690 675 623 608 511
Number of First Reports of Injury, by Population Type Total Employees Residents Students
MSB Corridor Blockage in Cumulative Occluded Linear Feet, by Month and Floor(building floor indicated at origin of each line) 7th 6th 5th 4th 3rd 2nd 1st G 2005 2004
COLLABORATIVE LABORATORY INSPECTION PROGRAM (CLIP) • During October 2005, 80 Principle Investigators for a total of 316 laboratory rooms were inspected • A total of 30 CLIP inspections were performed PI Inspections:
2005 Collaborative Laboratory Inspection Program (CLIP) Inspection Activities and Compliance Findings Number without violations Number with violations
2005 Collaborative Laboratory Inspection Program (CLIP) Inspection Activities and Compliance Findings Number without violations Number with violations
2005 Total Number of Monthly Workers Compensation Claims inclusive of the three most frequent identifiable classes of injuries Total Fall Strain Cut, Puncture
Fig. 3. Receipts of Radioactive Materials Number of non-medical use radioactive material receipts Number of medical use radioactive material receipts
Fig. 3. Receipts of Radioactive Materials Number of non-medical use radioactive material receipts Number of medical use radioactive material receipts
Fire Extinguisher Systems Fire Extinguishers Fire Related Incidents Asbestos Projects 1986 0 0 0 0 1996 203 19 91 55 1998 208 25 15 68 2003 437 46 -18 191
Outstanding Excellent Good Acceptable Note: Emery ranked as Assistant Professor 1999-2000, promoted to Associate Professor in 2002.
Annual SPH Faculty Activities Peer Review Results for Emery(15% Faculty Appointment) Outstanding Assoc Professor Asst Professor Excellent Good Acceptable
Summary • The ability to display data compellingly is the key to desired decision making • Always anticipate “compared to what?” • Maximize the data-to-ink ratio – e.g. eliminate the unnecessary • Think about what it is you’re trying to say • Show to others unfamiliar with the topic without speaking – does this tell the story we’re trying to tell?