Download
1 / 9
100 likes | 214 Vues
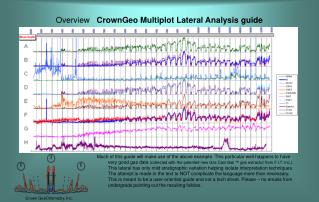
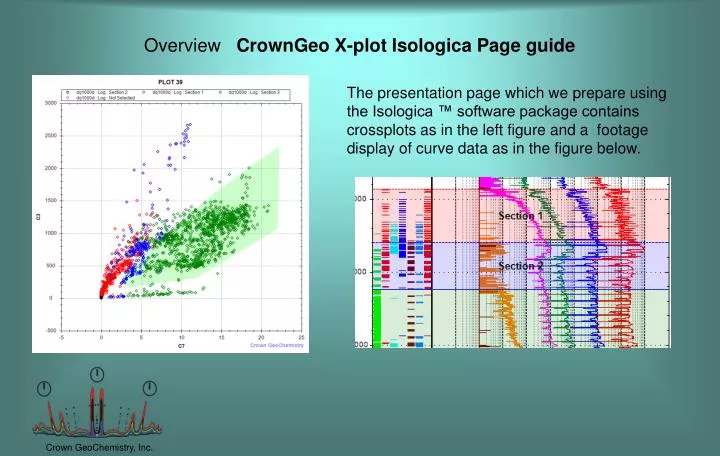
Overview CrownGeo X-plot Isologica Page guide. The presentation page which we prepare using the Isologica ™ software package contains crossplots as in the left figure and a footage display of curve data as in the figure below. Crown GeoChemistry, Inc.

E N D
Overview CrownGeo X-plot Isologica Page guide The presentation page which we prepare using the Isologica ™ software package contains crossplots as in the left figure and a footage display of curve data as in the figure below. Crown GeoChemistry, Inc.
Forward Markers CrownGeo X-plot Isologica Page guide The “Section 1” footage range data has been shaded in a red background colour below. Crown GeoChemistry, Inc.
Forward Markers CrownGeo X-plot Isologica Page guide All data from the footage range which has been shaded in this red background are displayed in every cross plot as red data symbols. This is called a FORWARD indicator. Crown GeoChemistry, Inc.
Reverse Markers CrownGeo X-plot Isologica Page guide The green shadow box in the crossplot was made by drawing it directly onto the crossplot Crown GeoChemistry, Inc.
Reverse Markers CrownGeo X-plot Isologica Page guide The data which are in the green shadow box cause a hash mark of the same colour to be drawn in the “DNA” panel to the left of the curve data. This is called a REVERSE indicator. Crown GeoChemistry, Inc.
Analytics CrownGeo X-plot Isologica Page guide The “DNA Map” appearance of the REVERSE indicators is not really an accident. The indicators are selected by grabbing data from the various crossplots that is anomalous or off trend. Since non-median and eccentric data is used for the indicators it can be used to help describe the nature of and then display the continuity limit of these off trend data profiles. Crown GeoChemistry, Inc.
Analytics CrownGeo X-plot Isologica Page guide One of the Sw indicators. This one picks the aromatics edge of an Aromatics vs. C6 crossplot with a blue shadow box (forward indicator). This plot is a fairly direct Sw indicator. Here the data which has elevated Sw potential tends to fall only in portions of the footage ranges which have red and blue FORWARD markers (red and blue data markers). Crown GeoChemistry, Inc.
Summary CrownGeo X-plot Isologica Page guide This presentation allows the client to see the continuity limits for flow compartments, and to see some of the nature of the compositional variation within the compartments. Crown GeoChemistry, Inc.
Summary CrownGeo X-plot Isologica Page guide Reverse Indicators marks are coded a little to help sort trends: Orange marks for light fractions. Blue marks for elevated Sw. Red marks for elevated poro/perm. Green marks for heavy fractions. Crown GeoChemistry, Inc.