Download
1 / 15
150 likes | 229 Vues
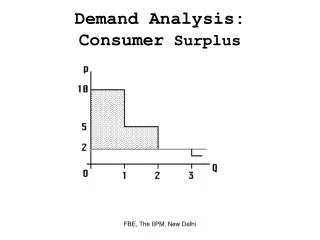
Consumer Surplus. How many rectangles do you see here? 3, I hope. There is A, B, and A+B. Some of what follows will require you to work with rectangles. Why, you ask? Why not! No, really it can make the job we have to accomplish easier.

E N D
How many rectangles do you see here? 3, I hope. There is A, B, and A+B. Some of what follows will require you to work with rectangles. Why, you ask? Why not! No, really it can make the job we have to accomplish easier. By the way, did you know that all squares are rectangles, but not all rectangles are square? A B The area of a triangle is half of the base times the height. Just don’t use the hypopotnoose.
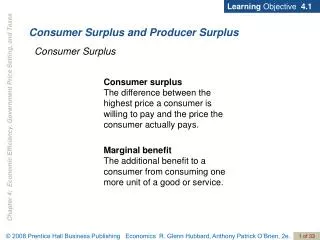
The Demand curve again P Note the axes are not drawn to the same scale. 7 5 3 1.5 1 .5 a b g c h l d i m p e j n q s f k o r t 1 2 3 4 5 Q
Another way to see the demand curve What is the (maximum) amount the person is willing to pay for the first unit on the demand curve one screen ago? Since the first unit is not demanded until the price is 5, we say the person is willing to pay $5 for 1 unit of the good. Note in the graph from before that the area made up of the part b, c, d, e, and f is the $5 the person is willing to pay for the first unit. (Area of a rectangle is base times height – 1 times 5 here)
Another way to see the demand curve Now, on the demand curve we see the person is willing to pay $3 for the second unit, but no more. This would be represented by areas h, i, j, and k. We could do this on and on for additional units. The point is that the amount the consumer is willing to pay for each unit is under the demand curve.
Consumer surplus for a person Say for the person we had before that they have to pay $1 for every unit they buy. The consumer surplus the individual would get on each unit would be: Unit willing to pay have to pay consumer surplus 1 5 1 4 b+c+d 2 3 1 2 h+i 3 1.5 1 .5 m 4 1 1 0 So the total consumer surplus for the individual is 6.5 This consumer surplus is the difference between what the consumer is willing to pay and what has to be paid. It represents money the consumer can use elsewhere.
Demand again P 7 5 3 1.5 1 .5 a b g c h l d i m p e j n q s f k o r t 1 2 3 4 5 Q
Market demand The market demand curve is simply the summation, or addition, of the demand each person has in a market. To get the market demand 1) look at each price 2) at each price add up what each person is willing to buy at that price. The quantity demanded in the market is simply the quantities added up at each price across the people in the market
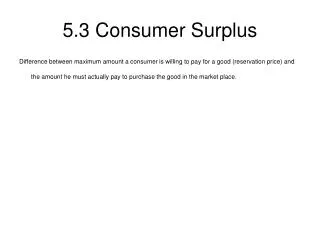
Consumer Surplus - CS P I am using the same example I did before, but now think of this as the market demand curve. 7 5 3 1.5 1 .5 a b g c h l d i m p e j n q s f k o r t 1 2 3 4 5 Q
CS On the previous screen someone is willing to pay $5 for the first unit. Note areas b, c, d, e and f add up to the $5. This is almost all the area under the demand curve out to one unit. If we add in area a we can say all the area under the demand curve out to a quantity is what the consumer is willing to pay for the first unit. Of course area a should not be included, but it makes life easy to add it in. So, the willingness to pay for any quantity is the area under the demand curve out to that quantity. When we have thousands of consumers in a market it would be tedious to look at each consumer separately and add up the surplus for each.
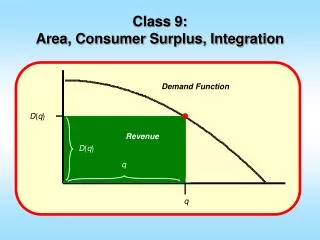
CS P S1 A B C P1 D1 Q Q1
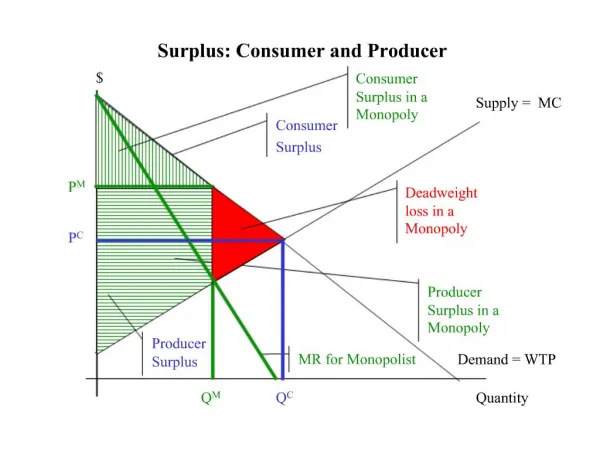
CS On the previous screen the market price and quantity traded are P1 and Q1, respectively. Consumer surplus is defined as what consumers are willing to pay for a product minus what they have to pay. At the market equilibrium of Q1 units consumers are willing to pay A + B + C, and consumers have to pay B + C (really P1 times Q1), so consumer surplus is A
CS Consumer surplus is a triangle in this example. The area of a triangle is one-half of the base times the height. Let’s see an example: area = .5(10)(16-7) = 45 16 7 10 0
CS Consumer surplus represents the utility consumers get from the products they buy over and above the utility they would have gotten had they bought something else. I like to also think of the consumer surplus as money the consumer has left over after buying the units. They would have paid these dollars for the units, but did not have to. So these dollars can be used somewhere else. So, if you can buy goods that you want and pay less than you are willing to pay, then you not only benefit from having the goods, you benefit from the mechanism by which you buy the goods. The consumer surplus from one item can be used elsewhere.
Consumer surplus in a market Consumer surplus for 1 consumer