Download

1 / 46
530 likes | 1.14k Vues
Consumer and Producer Surplus. AP Economics Mr. Bordelon. Consumer and Producer Surplus. Focus. Understand how buyers and sellers benefit from a competitive market and how big those benefits are.

E N D
Consumer and Producer Surplus AP Economics Mr. Bordelon
Focus • Understand how buyers and sellers benefit from a competitive market and how big those benefits are. • Consumer and producer surplus help us analyze what happens when competitive markets are inefficient or when there is interference with the market.
Consumer Surplusand the Demand Curve • Consumer surplus measures the difference between what a consumer is willing to pay for a good and what he actually has to pay. • Total consumer surplus generated by purchases of a good at a given price is equal to the area below the demand curve but above the price.
Consumer Surplusand the Demand Curve • Demand curve is created by the buyer’s tastes, and that in turn determines how much they gain from the opportunity to buy.
Willingness to Payand the Demand Curve • Willingness to pay. Maximum price at which buyer would buy a good. • Buyers won’t buy goods if it costs more than they are willing to pay. • Buyers will buy goods if it costs less than they are willing to pay. • If the price is equal to individual’s willingness to pay, buyer is indifferent between buying and not buying.
Willingness to Payand the Demand Curve • Members of my AP Econ class want to buy Guild Wars 2. We’ve asked each student the max price they would pay for the game, and here are the answers (willingness to pay):
Willingness to Payand the Demand Curve • How many units of GW2 will be purchased? • Price is $40. Ashley, Billy, Chantal and Dana will buy the game, but kylE will not. Quantity demanded is 4. • Price is $60. Ashley, Billy, and Chantal will buy the game, but Dana and kylE will not. Quantity demanded is 3. • Price is $20. All 5 will buy the game. Quantity demanded is 5.
Willingness to Payand the Demand Curve • WTP can be used as a demand schedule and graphed like a step demand curve. Height of the rectangles represent WTP.
Willingness to Payand Consumer Surplus • GW2 is $40. 4 units will be sold and those 4 consumers will benefit from the purchase. • Can we measure how happy they are?
Willingness to Payand Consumer Surplus • Ashley’s WTP was $100, so she figures she’ll receive $100 of enjoyment from the game, but only had to pay $40 for the game. • The difference can be seen as a net gain in happiness for Ashley and we can measure it in dollars consumer surplus.
Willingness to Payand Consumer Surplus Add them all up and we have total consumer surplus.
Willingness to Payand Consumer Surplus • And in graph form
Willingness to Payand Consumer Surplus • If we had an actual market, our curve would even out. Total consumer surplus would be the area below the demand curve and below the price. 1
Willingness to Payand Consumer Surplus • Individual consumer surplus. Net gain buyer achieves from purchase of a good. • Total consumer surplus. Sum of the individual consumer surpluses gained by all buyers of a good.
How Changing PricesAffect Consumer Surplus • When the price of a good falls, consumer surplus increases. • When the price of a good rises, consumer surplus decreases. • What explains this?
How Changing PricesAffect Consumer Surplus • Price is now $60. Only 3 units will be sold at higher price and total consumer surplus falls to $60.
How Changing PricesAffect Consumer Surplus • This table is represented now by the smaller triangle of CS. • The rectangular area and the triangular area below the new CS is lost CS. • How do you find the lost CS? $60 3
How Changing PricesAffect Consumer Surplus • Find the areas of both triangles, and subtract. • A = ½(60)(4) = $120 • A = ½(40)(3) = $60 • Lost CS = $120 – 60 = $60 $60 3
How Changing PricesAffect Consumer Surplus • Price is now $20. All 5 units will be sold at the lower price and total consumer surplus increases to $200.
How Changing PricesAffect Consumer Surplus • This table is represented now by the larger triangle of CS. • The new rectangular area and the triangular area is gained CS. • How do you find the gained CS? $20 5
How Changing PricesAffect Consumer Surplus • Find the areas of both triangles, and subtract. • A = ½($80)(5) = $200 • A = ½($40)(4) = $120 • Gained CS = $200 – 120 = $80 $20 5
How Changing PricesAffect Consumer Surplus • What if you were presented with a problem like this? • How would you find the increase in CS?
How Changing PricesAffect Consumer Surplus • Find the area of the rectangle and triangle, and add. • A = ($3,500)(200,000) = $700 million • A = ½($3,500)(800,000) = $1.4 billion • Gained CS = $700 million + $1.4 billion = $2.1 billion
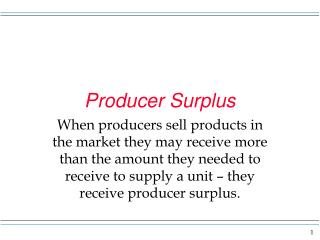
Producer Surplusand the Supply Curve • Producer surplus measures the difference between the price producers receive for a good and the cost of producing the good. • Total producer surplus from sales of a good at a given price is the area above the supply curve but below that price.
Producer Surplusand the Supply Curve • Sellers like higher prices and the benefit they get is equal to the difference between the price received from the sale and the production cost of each unit.
Cost and Producer Surplus • Cost. Lowest price at which seller is willing to sell a good. Includes opportunity cost! • Individual producer surplus. Net gain to an individual seller from selling the good. • Total producer surplus. Sum of the individual producer surpluses of all the sellers of a good in a market.
Cost and Producer Surplus • NCSoft has higher production costs as production increases. Let’s say it costs $10 to produce the first unit. NCSoft must receive a minimum of $10 before the unit is sold.
Willingness to Payand the Demand Curve • How many units of GW2 will be supplied? • Price is $40. 4 units will be supplied. • Price is $30. 3 units will be supplied. • Price is $50. 5 units will be supplied.
Cost and Producer Surplus • Production cost can be used as a supply schedule and graphed like a step supply curve. Height of the rectangles represent cost.
Cost and Producer Surplus • GW2 is $40. 4 units supplied and those suppliers will benefit from the purchase.
Cost and Producer Surplus • Cost is $10 per unit. For one unit, the cost is $10 at a price of $40. • The difference can be measured as a net gain for NCSoft and we can measure it in dollars producer surplus • PS = $40 - $10 = $30 for one unit.
Cost and Producer Surplus • Add them all up, and you have total producer surplus.
Cost and Producer Surplus • And in graph form.
Cost and Producer Surplus • Smoothing the curve out, total producer surplus would be seen as the area above the supply curve and below the price.
How Changing PricesAffect Producer Surplus • When the price of a good falls, producer surplus decreases. • When the price of a good rises, producer surplus increases. • What explains this?
How Changing PricesAffect Producer Surplus • Price of GW2 is now $30. Only 3 units will be supplied at lower price and total producer surplus falls to $30.
How Changing PricesAffect Producer Surplus • Price of GW2 is now $50. All 5 units will be supplied at the higher price and total producer surplus increases to $100.
How Changing PricesAffect Producer Surplus • What if you were presented with a problem like this? • How would you find the increase in PS?
How Changing PricesAffect Producer Surplus • Find the areas of the rectangle and triangle, and add. • A = (1,000,000)($2) = $2,000,000 • A = ½($2)(500,000) = $500,000 • Gained PS = $2,000,000 + $500,000 =$2.5 million
Summary of Changes in Price andConsumer and Producer Surplus • If price decreases, • Consumer surplus increases—willingness to pay is the same,but price paid is lower. • Producer surplus decreases—costs are the same, but the price received is lower. • If price increases, • Consumer surplus decreases—willingness to pay is the same, but the price paid is higher. • Producer surplus increases—costs are the same, but the price received is higher.
Problem 1 • Demand curve for a product is given by P = 40 – 2Qd • If current price = $20, compute total consumer surplus. • HINT: DRAW the curve out, and label it.
Problem 1 • CS = ½(20)(10) = $100
Problem 2 • Supply curve for a product is P = 2Qs • If current price = $60, compute total surplus. • HINT: DRAW supply curve, and label it.
Problem 2 • PS = ½(60)(30) = $900