Download

1 / 38
380 likes | 503 Vues
2012-2013 preliminary Accreditation Data. Suffolk Public Schools School Board August 9, 2012. Determining School Accreditation.

E N D
2012-2013 preliminary Accreditation Data Suffolk Public Schools School Board August 9, 2012
Determining School Accreditation • Based on the percentage of students passing the Standards of Learning (SOL) assessment tests in the four core academic areas• Calculated on the current year's scores or a trailing three-year average
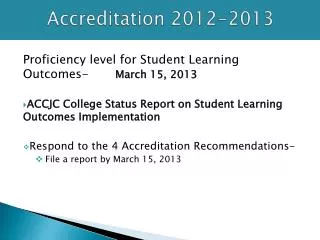
2012-2013 Accreditation Benchmarks Note: Ratings for the 2012-2013 school year are based on achievement during 2011-2012 or on average achievement during the three most recent school years. Accreditation Benchmarks Changes for the 2013-2014: Science and history and social science, the third grade pass rate will increase from 50 percent to 70 percent. English, the pass rate for grades six through twelve will increase from 70 percent to 75 percent.
Determining School Accreditation High School: Is based on the percentage of students graduating from or completing high school based on a Graduation and Completion Index (GCI) prescribed by the state board of education.
2011 – 2012 PRELIMINARY SOL TEST RESULTS - DIVISION LEVEL - - GRADE LEVEL -
SOL student performanceBY GRADE Level • READING • WRITING • MATH • HISTORY • SCIENCE
2010-2012 SOL Student Performance in Reading
CELEBRATIONS in English-Reading • BTWES – Grade 3 increased 9% • CES – Grade 3 increased 10% • CES – Grade 5 increased 6% • DES – Grade 3 increased 11% • EFES – Grade 5 increased 16% • HPES – Grade 4 increased 6% • KSES – Grade 3 increased 14% • KSES – Grade 5 increased 6%
CELEBRATIONS in English-Reading • MBJrES – Grade 3 increased 15% • MBJrES – Grade 5 increased 11% • NPES – Grade 3 increased 10% • NPES – Grade 5 increased 10% • NSES – Grade 5 increased 8% • OES – Grade 5 increased 11% • SWES – Grade 3 increased 14% • JFKMS – Grade 6 increased 6% • JFKMS – Grade 7 increased 5%
2010-2012 SOL Student Performance in Writing
CELEBRATIONS in English-Writing • DES – Grade 5 increased 7% • EFES – Grade 5 increased 7% • KSES – Grade 5 increased 7% • NPES – Grade 5 increased 8% • OES – Grade 5 increased 5%
2010-2012 SOL Student Performance in Math
CELEBRATIONS in Math • NSES – Grade 5 Plain English Math increased 25% • OES - Grade 4 Plain English Math increased 50% • FGMS - Grade 6 Plain English Math increased 13% • JFKMS - Grade 6 Math increased 17% • JYMS - Grade 6 Math increased 5%
2010-2012 SOL Student Performance in History
CELEBRATIONS in History • CES – Grade 3 increased 8% • EFES – Grade 4 Virginia Studies increased 5% • EFES – Grade 5 US History I increased 7% • HPES – Grade 3 History increased 9% • HPES – Grade 4 Virginia Studies increased 11% • HPES – Grade 5 US History I increased 26% • KSES – Grade 3 History increased 5% • MBJrES – Grade 4 Virginia Studies increased 6%
CELEBRATIONS in History • NPES – Grade 3 increased 8% • NPES – Grade 4 Virginia Studies increased 9% • NPES – Grade 5 US History I increased 8% • NSES – Grade 3 History increased 7% • NSES – Grade 5 US History I increased 6% • OES – Virginia Studies increased 8% • OES – Grade 5 US History I increased 19% • SWES – Grade 3 History increased 7%
CELEBRATIONS in History • JFKMS – Civics and Economics increased 10% • KFHS – World History I increased 11% • KFHS – World History II increased 28% • LHS – World History II increased 12%
2010-2012 SOL Student Performance in Science
CELEBRATIONS in Science • CES – Grade 5 increased 5% • EFES – Grade 5 increased 5% • HPES – Grade 5 increased 7% • KSES – Grade 5 increased 8% • MBJrES – Grade 5 increased 12% • NSES – Grade 5 increased 5% • OES – Grade 5 increased 10% • SWES – Grade 5 increased 5% • LHS – Biology increased 5%
2011-2012 SOL Student Performance by Elementary School
2011-2012 SOL Student Performance by Middle School NOTE: * Indicates the Alternate Benchmark (Three Year Average) was needed.
2011-2012 SOL Student Performance by High School Notes: 1. * - Indicates the Alternate Benchmark (Three Year Average). 2. Accredited with Warning – Pass rates are below the achievement levels required for full accreditation. Schools must undergo academic reviews and are required to adopt and implement school improvement plans. Schools that are Accredited with Warning in English and/or mathematics also are required to adopt instructional programs proven by research to be effective in raising achievement in these subjects. 3. The Graduation and Completion Index (GCI) data for the high schools is not available. The data will be calculated following the completion of summer school and the submission of the summer student record collection in August.
Action Steps Focused on Enhancing the Math Results • Analyze district Student Performance By Question (SPBQ) reporting category and SPBQ reports to identify areas of strength and improvement • Continue to develop additional Technology Enhanced Items • “Look-a-like” problems are being used as the framework for the pre-assessments and have been placed in curriculum management for teacher use.
Action Steps Focused on Enhancing the Math Results • Conduct a Needs Assessments of all teachers who teach math • Create Professional Development sessions based on the results of the Needs Assessment • Increase monitoring of teachers’ evidence of re-teaching and remediation (building administrators and central office administrators)
Action Steps Focused on the Revised English and Science Standards • SOL English Standards: • Adopted in 2010 and Implemented in 2011 • Field tested new online writing tool in 2012 • Field tested new reading & writing content in 2012 • SOL tested in 2013 • SOL Science Standards: • Adopted in 2010 and Implemented in 2011 • Field tested new content in 2012 • SOL tested in 2013
Action Steps Focused on the Revised English and Science Standards • Beginning in 2010, committees created: • Action plans & Time tables • Crosswalks comparison • -- Integrated critical portions of new standards without deleting current standards • Scope and sequences
Action Steps Focused on the Revised English and Science Standards • Beginning in 2010, committees also created: • Pacing guides • Updated student review notes • -- Infused certain critical standards one year • in advance of testing • Lessons & labs developed and included in teachers' curriculum guides in science
Action Steps Focused on the Revised English and Science Standards • Other action steps: • Teachers shared best practices • Students provided chance to use new online writing practice tool provided by VDOE in 2012 during SOL Writing field test
Action Steps Focused on the Revised English and Science Standards • Other action steps: • Provide students with practice using Technology Enhanced Practice Items provided by VDOE • Update division tests and quizzes to align with Technology Enhanced Items formatting