Download
1 / 11
130 likes | 661 Vues
Remote Sensing in Natural Hazard Monitoring Bruce H. Ramsay*, William Y. Tseng* , George Stephen*, Robert Fennimore*, and Fernando Sotelo** *NOAA/NESDIS, Washington, D.C. 20233, USA **Litton PRC, GOES Data Distribution System Support Contractor, Washington, D.C. 20233, USA Table of Contents

E N D
Remote Sensing in Natural Hazard Monitoring Bruce H. Ramsay*, William Y. Tseng* , George Stephen*, Robert Fennimore*, and Fernando Sotelo** *NOAA/NESDIS, Washington, D.C. 20233, USA **Litton PRC, GOES Data Distribution System Support Contractor, Washington, D.C. 20233, USA
Table of Contents • Introduction • OSEI Purpose • Support Policies • Defining a Natural Hazard/Significant Event • The Process • Identification of Significant Events • Notification Protocols • The Acquisition of Imagery • The Analysis of Imagery • The Production of Imagery • Quality Control
Table of Contents (Cont’d) • Storage and Dissemination of Data • Website Control and File Management • The Daily Report • Recent Event Supports and Examples
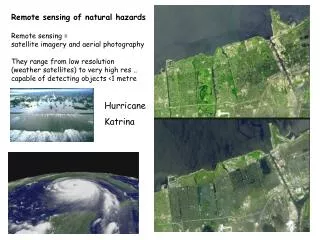
Introduction • OSEI Purpose • To produce and analyze remotely sensed imagery, in near real-time, from satellite sensors, for the identification and monitoring of short-term natural and anthropogenic hazards. • Imagery available in NOAA: NOAA-AVHRR, GOES, GMS, DMSP-SSM/I, TOMS-EP, METEOSAT, RADARSAT SAR, and SeaWiFS • Support Policies • Operational support • All locations in the world • Near real-time and quick turn around after an event
Introduction (Cont’d) • Defining a Natural Hazard/Significant Event • “Significant” depends upon one’s point of view. • “Significant Events” are defined not just in context with situations which produce spectacular remotely-sensed images, but also with those that have a severe impact to lives and property. • Typical Significant Events: Fires, Smoke, Volcanic Eruptions and Ash Plumes, Tropical Cyclones, Floods, Oil Spills, Snow Cover or Ice, Dust Storms, Tornado Outbreaks, Storms, and Red Tides.
The Process • Identify Significant Events • Define Significance and Classify the “Significance Threshold (ST)” from ST0 (lowest) to ST3 (highest). • Notify the OSEI Team Members • Acquire, Analyze and Produce Imagery • Quality Control • Store, Disseminate and Archive Data • Daily Operational Significant Event Support Report
Recent Event Supports and Examples • Fires: Southeast Asia, Australia, Brazil, Canada, Central America, Guyana, Indonesia, Mexico, the Philippines, and the United States • Dust: Africa, East Asia, MidEast and the Pacific Ocean • Floods: Afghanistan, Argentina, Kenya, Pakistan, Peru, Somalia, and the United States • Snow Cover or Ice: The Antarctic, and the Arctic, Canada, and the United States
Recent Event Supports and Examples (Cont’d) • Storms, Tornado, or Tropical Cyclones: Canada, Europe, Japan, India, Russia and Georgia, the Philippines, the United States, etc. • Smoke: SE Asia, Japan, South America, Italy, and the United States • Volcanic Eruptions: Hawaii, Soufriere Hills, Kamchatka Peninsula (near Bering Sea), Montserrat, Pavlof, and El Arenal (in Costa Rica) • Oil Spills: Coastal oceans off Pakistan, Japan, and Paraguay • Red Tides: Hong Kong
Future Plans • Implement 7X24 support. • Implement “list serve” capability. • Develop automate data acquisition/event identification/classification system - Hazard Mapping System (HMS). • Develop a simple and more friendly image processing software.
Discussion and Conclusion • All imagery supports are emphasized on the operational objective, rather than on the scientific purpose. • Since the turn-around time of imagery support for an event is about three hours, a detailed study of the imagery is impossible. Therefore, a bias in the event location and reality is inevitable.
Discussion and Conclusion (Cont’d) • Ground truth data are usually not available when the imagery is issued and disseminated to the customer. • The imagery support, however, has still been proved to be a very useful, economical, and effective method for identifying and monitoring larger-scaled events.