Download
1 / 17
170 likes | 393 Vues
Lincoln Community Greenhouse Gas Emission Inventory. Prepared by: Lincoln-Lancaster County Health Department. Calendar Year 2008 . Presented by: Doug Tangeman, EEI. Overview. Background and Methods Emissions Breakdown Key Results Community Comparisons Future Improvements.

E N D
Lincoln Community Greenhouse Gas Emission Inventory Prepared by: Lincoln-Lancaster County Health Department Calendar Year 2008 Presented by: Doug Tangeman, EEI
Overview • Background and Methods • Emissions Breakdown • Key Results • Community Comparisons • Future Improvements
Inventory Benefits • Establishes a baseline (where are we now?) • Where are emissions actually generated? • What areas can we most effectively improve upon? • How do we compare to other cities/regions? • Increasing regulation • GHG emissions reporting now required by EPA for many regulated sources • GHG inventories already mandated in some states
Background and Methods • Abbreviations • GHG = Greenhouse Gas • CO2e = Carbon Dioxide Equivalent. A particular gases’ global warming potential over 100 years relative to carbon dioxide • Carbon Dioxide (CO2) = 1 • Methane (CH4) = 21 • Nitrous Oxide (N2O) = 310 • Sulfur Hexafluoride (SF6) = 23,900 • eGRID = Emissions & Generated Resource Integrated Database • CFC/PFC = Chlorofluorocarbon/Perfluorocarbon • CACP Software = Clean Air and Climate Protection Software • ICLEI = International Council for Local Environmental Initiatives
Background and Methods • “Lincoln Community” defined as the city limits • When no city wide data was available, used ratio of Lincoln population to total population for which data was available • Emissions from purchased electricity determined using EPA’s eGRID model • Inventoried CO2, CH4, N2O, and SF6 emissions • Does not include emissions from CFCs or PFCs • Made best effort to use fuel consumption data • Emissions assigned to one of five “sectors” (groups) • Emissions calculated and totaled using CACP v. 2.2.1b
Sources of Data • Utilities • Lincoln Electric System • Black Hills Energy • Lincoln Water/Wastewater • Industry • Regulated air pollution sources • Emergency/Non-emergency generators • Transportation • VMT estimates from planning • Nebraska DMV • BNSF & UPRR • Private aviation • Other • Landfills • Energy Information Administration
Where are we now? Lincoln 2008- 4,775,088 Metric Tons (tonnes) CO2e *2008 U.S. Total = 7,052,600,000 Metric Tons CO2e (U.S. Energy Information Administration Estimate)
Residential Tonnes CO2e Industrial Commercial
Transportation • Includes: • On road vehicles • Locomotives • Private Aviation Tonnes CO2e
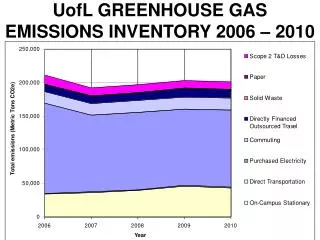
What areas can we improve upon? • Over 2.8 million tonnes of CO2e are from electricity and natural gas used to light, heat, and cool homes and businesses • Another 700,000 tonnes are generated from personal vehicle use • These combine to account for nearly 75% of all GHG emissions
What areas can we improve upon? • Significantly reducing emissions means efforts must be made across ALL sectors • Reductions in home and office heating/cooling use • Changes in driving habits
How do we compare? Population from U.S Census Bureau July 1st, 2008 estimate United States emission estimate from Energy Information Administration 2008 U.S. Greenhouse Gas Emission Inventory Report
Historical Trends http://www.census.gov/popest/data/national/totals/1990s/tables/nat-total.txt http://www.census.gov/popest/data/state/totals/2009/tables/NA-EST2009-01.xls http://www.epa.gov/climatechange/Downloads/ghgemissions/US-GHG-Inventory-2012-Chapter-2-Trends.pdf
Historical Trends http://www.census.gov/popest/data/national/totals/1990s/tables/nat-total.txt http://www.census.gov/popest/data/state/totals/2009/tables/NA-EST2009-01.xls http://www.epa.gov/climatechange/Downloads/ghgemissions/US-GHG-Inventory-2012-Chapter-2-Trends.pdf