Download
1 / 11
110 likes | 247 Vues
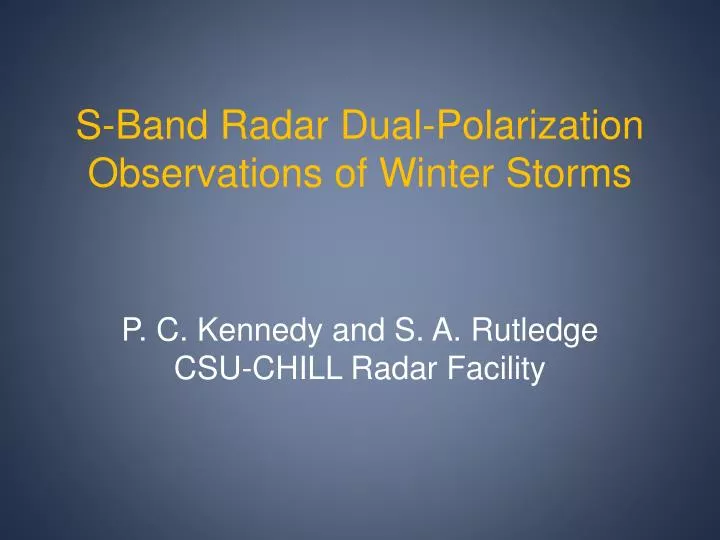
S-Band Radar Dual-Polarization Observations of Winter Storms. P. C. Kennedy and S. A. Rutledge CSU-CHILL Radar Facility. CSU-CHILL Data Overview. 3 dB beamwidth ~1 o Alternating H, V transmit polarization 11 cm wavelength Scan rates 6-10 o s -1 PPI and 1 o s -1 RHI

E N D
S-Band Radar Dual-Polarization Observations of Winter Storms P. C. Kennedy and S. A. Rutledge CSU-CHILL Radar Facility
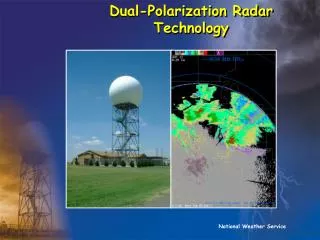
CSU-CHILL Data Overview • 3 dB beamwidth ~1o • Alternating H, V transmit polarization • 11 cm wavelength • Scan rates 6-10 os-1 PPI and 1 os-1 RHI • Wang and Chandrasekar (2009) Kdp • Data collected when significant winter precipitation expected within ~100 km of Greeley, CO
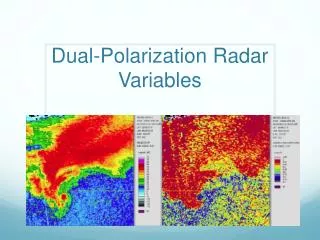
20 Dec 2006 1419 UTC 3.5o PPI data Temperatures from 12 UTC DNR sounding Reflectivity (dBZ) Kdp (o km-1 x 10)
20 Dec 2006 1442 UTC 3.5o PPI data Reflectivity (dBZ) Kdp (o km-1 x 10)
20 Dec 2006 1504 UTC 3.5o PPI data Reflectivity (dBZ) Kdp (o km-1 x 10)
20 Dec 2006 1504 UTC 3.5o PPI data Unfolded radial velocity (ms-1); multi-day KDEN closure starts ~22 UTC
20 Dec 2006 1502 UTC 156.8 o RHI Aggregation reflectivity profile; max Kdp layer aloft Reflectivity (dBZ) Kdp (o km-1)
Storm 2: 18 March 2003 Kdp (0 km-1 x 10) at 4.2o PPI as heavy snow period starts at KFCL Rings are -10, -15, -20 o C from LBF 12 UTC sounding 1844 UTC 2004 UTC
Height profiles extracted from RHI scan data in the two storms Kdp max near -15 o C level; polarimetric traces imply aggregation with descent
T-Matrix simulations of Kdp generation from ice particles Lo and Passarelli (1982) DSD: 0.2 to 2.0 mm diameter “dendrites” “Aggregated” particle population: Kdp=.09 o km-1; Zdr=0.3 dB; Zh=19 dBZ
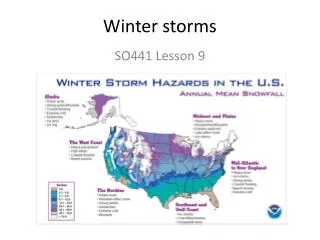
Summary • Several 10th’s of a o km-1 Kdp values observed at S-Band in major winter storms (see also Trapp et al 2001.) • Kdp values maximize near the -15o C ambient temperature level • Scattering model results suggest that suitable populations of dendritic crystals can generate observed Kdp magnitudes (in situ obs needed) • Positive Kdp areas near -15 o C level may be an indication of active dendritic particle growth