Download
1 / 33
330 likes | 463 Vues
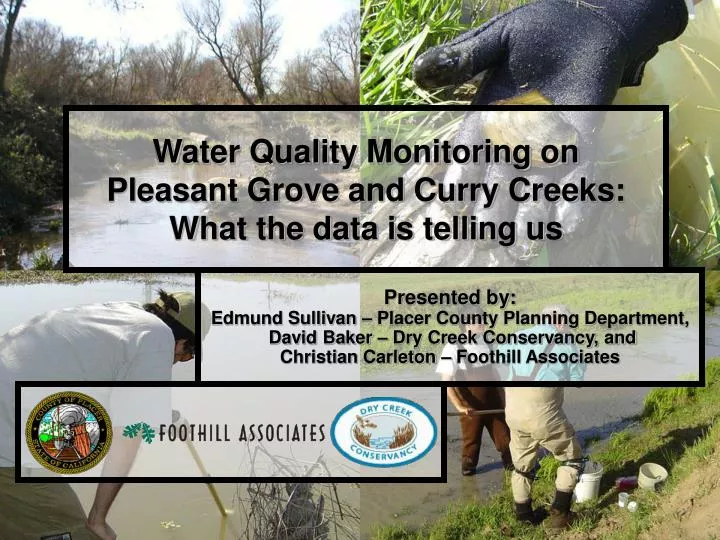
Water Quality Monitoring on Pleasant Grove and Curry Creeks: What the data is telling us. Presented by: Edmund Sullivan – Placer County Planning Department, David Baker – Dry Creek Conservancy, and Christian Carleton – Foothill Associates. Presentation Outline.

E N D
Water Quality Monitoring on Pleasant Grove and Curry Creeks:What the data is telling us Presented by:Edmund Sullivan – Placer County Planning Department, David Baker – Dry Creek Conservancy, andChristian Carleton – Foothill Associates
Presentation Outline • Introduction (Edmund Sullivan) • Monitoring Program Overview (David Baker) • Biological (Christian Carleton) • Habitat • Benthic Macroinvertebrates • Basic Water Quality Parameters (David Baker) • Field Tests • Nutrients & Other Lab Parameters • Extended Water Quality Parameters (Christian Carleton) • Metals • Organics • What is Next? • Questions & Answers
Purpose of Water Quality Monitoring Program by Edmund Sullivan • Ecosystem Restoration Plan (ERP) • Collect Baseline Stream Data • Preliminary Watershed Assessment
Monitoring Program Overview by David Baker • Selection of Monitoring Sites • Steps to a Reliable Monitoring • Monitoring Equipment Issues • Quality Assurance Program Plan (QAPP) • Field Parameters • Lab Parameters
Selection of Monitoring Sites • Historical or current land use (agriculture, municipal, industrial, mining, recreational, etc.) with potential WQ impairment? • Is there previous WQ data that could be used? • Is access safe? • Is permission to cross private property granted? • Is the sample representative of the water body of interest?
Steps to Reliable Monitoring Data • Quality Assurance Program Plan (QAPP) • Standard Operating Procedures • Implement Appropriate Data Management • Independent QA/QC Review • Routine Back-Up of All Monitoring Data • Select/Develop Database • DATAMON (Excel on Steroids) • SWAMP Database (Being Adapted for Watershed Groups) • Develop Calibration Forms & Field Sheets
Quality Assurance Program Plan (QAPP) • The QAPP is not only about doing a good analytical job but also being able to prove it • With a qualified staff, watershed groups can produce data on par with professionals • Provide adequate training for all monitoring personnel and have them work under direct supervision of a qualified technical specialist • Specialize work, such as initial equipment calibrations and data review, are best done by the technical staff or trained interns
Monitoring Equipment • HydroLab multi-sensor probe • Velocity Meter • GPS • Camera • Field Data Sheets • Sample Collection Bottles
Monitoring Equipment Issues • Hydro Lab Probe Purchase Was Delayed • Used Dry Creek Conservancy’s Meters for Initial Monitoring • New Equipment Successful for Second Round
Laboratory Sample Analyses • PG/CC Program Recognizes Analytical QA/QC Requirements Met by State Laboratory Certification Process • Select Methods with the Appropriate Quantitation Limits for WQ Parameters • Coordinate with Analytical Laboratory Staff for Timely Processing of Samples • Use Laboratory Containers, Chain-of-Custody Forms and Sampling Instructions
Field Parameters • pH • Electrical Conductivity (E.C.) • Turbidity • Temperature • Dissolved Oxygen (D.O.)
Laboratory Parameters • Solids (TDS, TSS, Settleable Solids) • Oil & Grease • Alkalinity (Titration Method) • Nutrients (Nitrates, Nitrites, Ammonia-N & Orthophosphate) • Total Organic Carbon (TOC) • Biological Oxygen Demand (BOD) • Metals, CAM 17 (ICP-MS Method) • Pesticides (Organophosphorous, Organochlorine & Glyphosate) • Bacteria (Total Coliform and E. coli)
Biological Monitoring by Christian Carleton • Benthic Macroinvertebrates (BMI) • Habitat Assessment
Benthic Macroinvertebrates (Aquatic Insects & Other Critters) • Surveyed upper and lower sections of PG/CC Watershed and selected sites to best reflect typical conditions throughout watershed • Access to private property problematic and finding suitable reaches with riffles difficult • Timing of initial BMI sampling not quite optimal and previous selected sites in the lower watershed were dry
Benthic Macroinvertebrates Continued… • Standard CA Stream Bioassessment Procedure (CSBP) not really applicable to low gradient streams • Our expert, Wayne Fields, helped adapt the current State sampling method • Planning an optimal BMI sampling in early spring • Some interesting critters found • Review of preliminary data?
Habitat Assessment • Part of the CSBP • Method for placing a numerical value on stream habitat quality • Qualitative assessment of 10 different stream habitat parameters • Completed by committee
Basic Physical Water Quality Parameters by David Baker • Field Test • Nutrients • Bacteria • Others
Temperature • pH • DO • %DO • Specific Conductance • TDS • Turbidity • Velocity • Depth Field Tests • Basic physical and water quality parameters that can be easily measured with field instruments
Nutrients & Other Basic Parameters • Nutrients used by 1° producers (aquatic plants and algae) • Excess nutrients cause eutrophication • Biochemical Oxygen Demand (BOD) is a measure of the biologically available organic matter • Coliform (bacteria) present in the water
Some Laboratory Results • Nitrate, Nitrite, Phosphate, Settleable Solids and E.coli were below detection limits in all samples analyzed to date
Extended Water Quality Parameters by Christian Carleton • Metals • Organics (Herbicides & Pesticides)
Metals • Used in various industrial processes • Present in some chemicals used as herbicides and pesticides • Will bioaccumulate • Can be toxic at low levels to certain organisms and people (e.g. mercury)
Organics (Pesticides & Herbicides) • Contain an organic chain within the molecule • Will adsorb to detritus (benthic organic matter) • Organochlorine Herbicides • Organophosphate Pesticides • Pesticides • Glyphosate (“Round-Up”)
What is Next? • Sampling in the Fall, First Flush, Winter • BMI in Spring • Possible Sampling in Spring • Will be reviewing data and update monitoring plan as needed
THANK YOU THE END! www.placer.ca.gov www.foothill.com www.drycreekconservancy.org