Download
1 / 13
240 likes | 319 Vues
Graphing Linear Inequalities. A linear inequality in two variables is an inequality that can be written in one of the following forms:. A x + B y £ C. A x + B y ³ C. A x + B y < C. A x + B y > C.

E N D
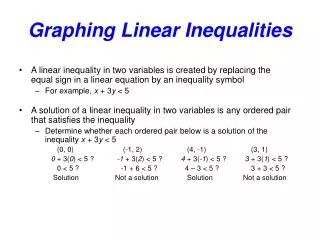
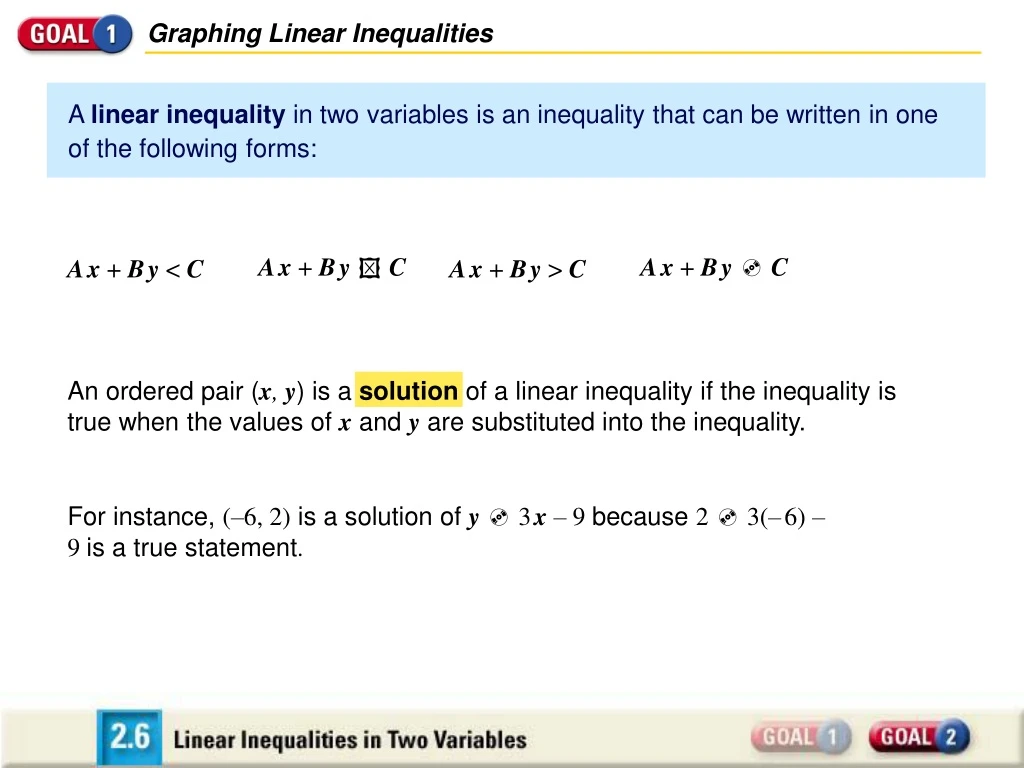
Graphing Linear Inequalities A linear inequality in two variables is an inequality that can be written in one of the following forms: Ax + By£C Ax + By³C Ax + By < C Ax + By > C An ordered pair (x, y) is a solution of a linear inequality if the inequality is true when the values of x and y are substituted into the inequality. For instance, (–6, 2) is a solution of y³ 3x – 9 because 2 ³ 3(–6) – 9 is a true statement.
Checking Solutions of Inequalities ³ 5 Check whether the given ordered pair is a solution of 2x + 3y³ 5. (0, 1) SOLUTION Ordered Pair Substitute Conclusion (0, 1) is not a solution. 2(0) + 3(1) = 3 (0, 1)
Checking Solutions of Inequalities ³ 5 Check whether the given ordered pair is a solution of 2x + 3y³5. (0, 1) (4, –1) SOLUTION Ordered Pair Substitute Conclusion (0, 1) is not a solution. 2(0) + 3(1) = 3 (0, 1) (4, –1) ³ 5 2(4) + 3(–1) = 5 (4, –1) is a solution.
Checking Solutions of Inequalities ≥ 5 Check whether the given ordered pair is a solution of 2x + 3y³ 5. (0, 1) (4, –1) (2, 1) SOLUTION Ordered Pair Substitute Conclusion (0, 1) is not a solution. 2(0) + 3(1) = 3 (0, 1) (4, –1) ³5 2(4) + 3(–1) = 5 (4, –1) is a solution. (2, 1) 2(2) + 3(1) = 7 ³ 5 (2, 1) is a solution.
Graphing Linear Inequalities ACTIVITY Developing Concepts 1 2 3 Investigating the Graph of an Inequality Test each point on the scatter plot to see whether it is a solution of x + y³ 1. If it is asolution, color itblue. If it isnot a solution, color itred. • • • • x + y³ 1 –1 1 –2 1 –1 –2 2 2 –2 –1 2 1 ( –2 , –2 ) ( –1 , –2 ) ( –1 , –1 ) ( 1 , –2 ) ( 1 , 1 ) ( 2 , 1 ) ( –2, 1 ) ( 2, 2 ) • • • • Graph the line x + y = 1. What relationship do you see between the colored points and the line? Describe a general strategy for graphing an inequality in two variables.
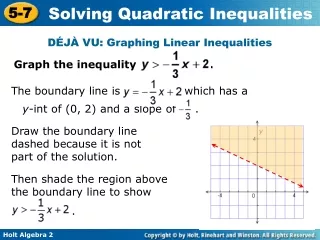
Graphing Linear Inequalities 1 2 STEP STEP The graph of a linear inequality in two variables is the graph of all solutions of the inequality. The boundary line of the inequality divides the coordinate plane into two half-planes: a shaded region which contains the points that are solutions of the inequality, and an unshaded region which contains the points that are not. GRAPHING A LINEAR INEQUALITY The graph of a linear inequality in two variables is a half-plane. To graph a linear inequality, follow these steps. Graph the boundary line of the inequality. Use a dashed line for < or > and a solid line for £or³. To decide which side of the boundary line to shade, test a point not on the boundary line to see whether it is a solution of the inequality. Then shade the appropriate half-plane.
Graphing Linear Inequalities in One Variable Graph y< –2 and x£ 1 in a coordinate plane. SOLUTION Graph the boundary line y = –2. Use a dashed line because y < – 2. Test the point (0, 0). Because (0, 0) is not a solution of the inequality, shade the half-plane below the line.
Graphing Linear Inequalities in One Variable Graph y< –2 and x£1 in a coordinate plane. SOLUTION Graph the boundary line y = –2. Use a dashed line because y < – 2. Graph the boundary line x = 1. Use a solid line because x£1. Test the point (0, 0). Test the point (0, 0). Because (0, 0) is not a solution of the inequality, shade the half-plane below the line. Because (0, 0) is a solution of the inequality, shade the half-plane to the left of the line.
Graphing Linear Inequalities in Two Variables Graph y< 2x and 2x – 5y³ 10. SOLUTION Graph the boundary line y = 2x. Use a dashed line because y < 2x. Test the point (1, 1). Because (1, 1) is a solution of the inequality, shade the half-plane below the line.
Graphing Linear Inequalities in Two Variables Graph y< 2x and 2x – 5y³ 10. SOLUTION Graph the boundary line y = 2x. Use a dashed line because y < 2x. Graph the boundary line 2x – 5y= 10. Use a solid line because 2x – 5y ³ 10. Test the point (1, 1). Test the point (0, 0). Because (1, 1) is a solution of the inequality, shade the half-plane below the line. Because (0, 0) is not a solution of the inequality, shade the half-plane below the line.
Using Linear Inequalities in Real Life United States rate United States time Mexico rate Mexico time Value of Card £ + • • You have relatives living in both the United States and Mexico. You are given a prepaid phone card worth $50. Calls within the continental United States cost $.16 per minute and calls to Mexico cost $.44 per minute. Write a linear inequality in two variables to represent the number of minutes you can use for calls within the United States and for calls to Mexico. SOLUTION Verbal Model (dollars per minute) United States rate =0.16 Labels (minutes) United States time =x Mexico rate =0.44 (dollars per minute) (minutes) Mexico time =y (dollars) Value of card =50 …
Using Linear Inequalities in Real Life You have relatives living in both the United States and Mexico. You are given a prepaid phone card worth $50. Calls within the continental United States cost $.16 per minute and calls to Mexico cost $.44 per minute. Write a linear inequality in two variables to represent the number of minutes you can use for calls within the United States and for calls to Mexico. … Algebraic Model 0.16 x + 0.44 y£ 50 Graph the inequality and discuss three possible solutions in the context of the real-life situation. Graph the boundary line 0.16 x + 0.44 y = 50 . Use a solid line because 0.16 x + 0.44y£ 50.
Using Linear Inequalities in Real Life You have relatives living in both the United States and Mexico. You are given a prepaid phone card worth $50. Calls within the continental United States cost $.16 per minute and calls to Mexico cost $.44 per minute. Graph the inequality and discuss three possible solutions in the context of the real-life situation. Test the point (0, 0). Because (0, 0) is a solution if the inequality, shade the half-plane below the line. Finally, because xand y cannot be negative, restrict the graph to the points in the first quadrant. One solution is to spend 65 minutes on calls within the United States and 90 minutes on calls to Mexico. Possible solutions are points within the shaded region shown. To split time evenly, you could spend 83 minutes on calls within the United States and 83 minutes on calls to Mexico. The total cost will be $49.80. You could instead spend 150 minutes on calls within the United States and only 30 minutes on calls to Mexico. The total cost will be $37.20.