Download

1 / 13
130 likes | 137 Vues
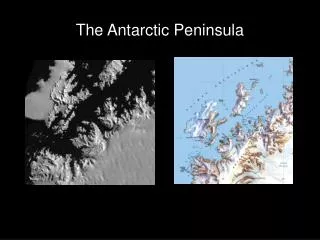
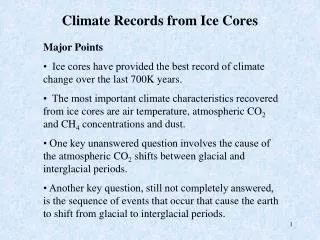
Circulation changes on Antarctic Peninsula from ice cores. Liz Thomas 1 , Gareth Marshall 1 Joe McConnell 2 & Paul Dennis 3 British Antarctic Survey Desert Research Institute University of East Anglia. BAS Core locations. James Ross Island. Faraday. Beethoven 1991 – 1948 Berkner

E N D
Circulation changes on Antarctic Peninsula from ice cores Liz Thomas1, Gareth Marshall1 Joe McConnell2 & Paul Dennis3 British Antarctic Survey Desert Research Institute University of East Anglia
BAS Core locations James Ross Island Faraday • Beethoven • 1991 – 1948 • Berkner • 948 m (completed 2004) • Dolmen Island • 1982- 1651 • Dyer Plateau • D1 1988-1820 • D2 1989-1506 • James Ross Island • 365 m (completed 2008) • Gomez • 2006-1850 Rothera Dyer Plateau (1&2) Dolman Island Beethoven Gomez Berkner Island
Drill site • Medium depth ice core drilled to a depth of 136 meters with an electromechanical, 104 mm diameter drill • Encompasses the period between 1855 – 2006 (150 years) • Ground penetrating radar (GPR) used to asses accumulation variability Gomez ice core (73.59°S, 70.36°W, 1400 m a.s.l)
Site selection • Strong SAM signal from reanalysis data • High accumulation site • High resolution records • Increased elevation (1992-2003), thought to be due to greater snowfall • satellite altimeter data • [Davis et al., 2005; Wingham et al., 2006]. Correlation between SAM and precipitation from ECMWF 1980-2004
Methods • Continuous Flow Analysis with Trace Elements-Dual • The annual accumulation record was derived using two methods: • winter-winter value determined from the minima of hydrogen peroxide (H2O2) • summer-summer value based on maxima in non-sea salt sulphate (nssS) • Estimated uncertainty in the dating is ±1 year from 1855 to 1875 and <<1 year from 1875 to 2006
Gomez Accumulation record • Annual thicknesses converted to water equivalents • corrected for thinning assuming a linear strain rate • Doubling of accumulation: the mean for 1855-64 was 0.49 mweq y-1 while that for 1997-2006 was 1.10 mweq y-1 • Most rapid increase in recent period, following a slight reduction in the 1970s Annual snowfall at the Gomez site (dashed) and decadal average (solid) Elizabeth R. Thomas., G., J, Marshall., Joseph R. McConnell, (2008), A doubling in accumulation in the western Antarctic Peninsula since 1850, Geophysical Research Letters, 35
Atmospheric circulation Two principal spatial patterns related to known modes of atmospheric circulation variability • SAM • strong negative correlations over the Antarctic continent with ring of positive correlations to the north (exception of the south-east Pacific) Correlation map of Gomez accumulation vs. 500 hPa geopotential height, 1958-2006
Atmospheric circulation • Correlation, SAM and the Gomez accumulation record is 0.41 • 28% of the increase in snowfall (1957-2006) due to positive trend in the annual SAM Correlation map of Gomez accumulation vs. 500 hPa geopotential height, 1958-2006
Relationship with ENSO • No significant relationship over the entire 1866-2005 period • Some periods when significant (<10% level) positive correlation with the SOI: El Niño = less accumulation • But also periods when negative correlations exist Running 21-year correlations between Gomez accumulation and the Southern Oscillation Index
Marine signal • Large marine input • Average Na+ (1854- 2006) 39 ppb • Increase in sea salts since 1950’s • Changes in sea salt ratio’s • increased continental input? • Is changing atmospheric circulation affecting the marine signal?
Back trajectories • BADC (www.badc.ac.uk) • Daily release over 5 days • Location, height, temperature • To help identify source of chemical and isotope signal in ice core • Combined with satellite data to identify individual storm events 2 weeks of back trajectory data from Gomez site (Jan 2004)
Isotopes • Isotope (d18O) record • Compared with 18 months surface temp from AWS (r2 = 0.89) • In combination with other chemistry and a mean seasonal cycle of precipitation, aim is to derive seasonal time series • Back-trajectory analysis to try to understand intra-annual variability Isotope record from Gomez approx bi-weekly resolution
Conclusions • The Gomez ice core reveals a doubling of accumulation over the past 150 years • change is restricted to the central and southern Antarctic Peninsula • The SAM is a major driver of accumulation variability in the region. • Gomez accumulation provides a good proxy of the SAM • next step to compare with 150 year SAM reconstructions • No consistent ENSO signal in SW Peninsula accumulation (similar to West Antarctica) • Gomez core will allow us to derive a temperature record in the southwestern peninsula since 1850 and several other proxy records at a sub-seasonal timescale • Back trajectories used to identify source of ins in ice core • Help answer questions relating to sea ice effect on temperature