Download
1 / 62
640 likes | 921 Vues
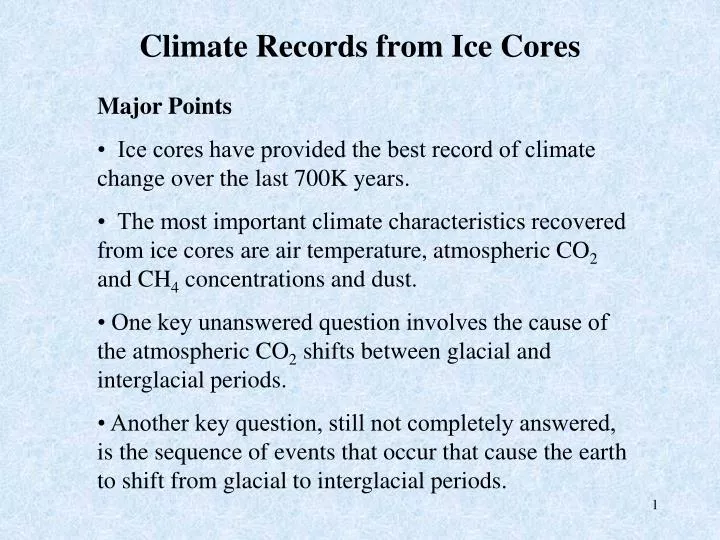
Climate Records from Ice Cores. Major Points • Ice cores have provided the best record of climate change over the last 700K years. • The most important climate characteristics recovered from ice cores are air temperature, atmospheric CO 2 and CH 4 concentrations and dust.

E N D
Climate Records from Ice Cores Major Points • Ice cores have provided the best record of climate change over the last 700K years. • The most important climate characteristics recovered from ice cores are air temperature, atmospheric CO2 and CH4 concentrations and dust. • One key unanswered question involves the cause of the atmospheric CO2 shifts between glacial and interglacial periods. • Another key question, still not completely answered, is the sequence of events that occur that cause the earth to shift from glacial to interglacial periods.
Dome C, Antarctica
Tools of the Trade L L L L L
Ice Cores from Greenland Firn Ice Compact Ice Bedrock
Ice Cores and Ice Sheet Flow “Dome” Age of Ice: annual layers (Greenland)- accurate but limited in age ice flow models (Antarctica)- less accurate but extends age range annual
Air Temperature Proxies • Two Methods • First, based on measured 18O/16O or D/H of ice recovered from ice core. • Second, based on measured depth profile of temperature of ice (borehole temperature) • In Greenland, the two methods do not agree and the borehole method is considered more accurate and used to calibrate the 18O/16O method. • In Antarctica, the 18O/16O method apparently works well.
Effect of Condensation on the d18O (and dD) of Precipitation -the amount of water vapor contained in air depends on air temperature -as air cools, water vapor (enriched in H2O18) condenses -as condensation occurs, the remaining vapor becomes depleted in H2O18 [vs SMOW]
d18O of Today’s Precipitation vs Air Temperature d18O (‰ vs SMOW) -strong linear correlation between d18O (and dD) of precip and air temp ΔTemp/Δd18O = ~1.4ºC / 1‰ ΔTemp/ΔdD = ~0.2ºC / 1‰ Air Temp (ºC)
Borehole Temperature Record in Ice Cores Scientists measure the temperature of ice directly by lowering a thermometer into the borehole that was drilled to retrieve the ice core. Like an insulated thermos, snow and ice preserve the temperature of each successive layer of snow, which reflects general atmospheric temperatures when the layer accumulated (although diffusion of heat alters the depth profile, but in a predictable way).
d18O versus Borehole Paleothermometrya controversy in Greenland Ice Cores (DTemp/Dd18O= 1.5 ºC / ‰) using current precipitation DTemp/Dd18O= 3 ºC / ‰ using Borehole Temps Climate scientists favor the borehole temperature changes.
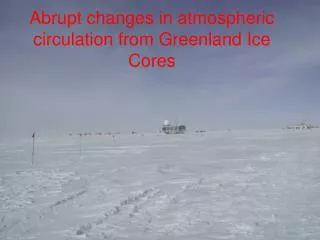
Greenland Drilling Sites (most notable are the GISP and GRIP sites started in 1990s)
Greenland Ice Core d18O and Temperature Record Using borehole temperature vs d18O calibration
Temperature Swings between Glacial and Interglacial Conditions ΔTa 36 24 21 a Bore Hole calibrn ΔTemp/Δd18O about equal for borehole and precipitation in Antarctica
Reconstructing Atmospheric Gas Concentrations from Ice Cores • Use trapped air bubbles as preserved samples of atmosphere. • Measure the concentration of important (greenhouse) atmospheric gases on the trapped air bubbles (e.g., CO2, CH4, N2O)
Trapping Air Bubbles in Ice Snow Accumulation Rates Greenland = 0.5 m/yr Antarctica = 0.05 m/yr
How does age of air bubbles compare to age of ice? • Determine the age of the ice (annual layer or flow model). • Determine the age of the trapped air bubble. -bubble age doesn’t equal ice age, it’s younger. • How long does it take for the ice to seal? - ~50 meters divided by snow accumulation rate - 50m / 0.5 m/yr = ~100 yrs in Greenland - 50m / 0.05 m/yr = ~1000 yrs in Antarctica • Why is this lag between ice and bubble ages important?
Industrial Era Changes in Atmospheric CH4 and CO2 Extending the record of industrial era change Tests the accuracy of ice core gas measurements
Methane (CH4) Gas in the Atmosphere • A greenhouse gas and climate indicator. • Natural (pre-anthropogenic) CH4 sources are dominated by emissions from wetlands (swamps, tundra, bogs, etc.). • Biogenic methane is produced by microbes under anoxic (no oxygen) conditions. CO2 + H2 CH4 + H2O CH2COOH CH4 + CO2 • Methane Hydrates (?)
Atmospheric Methane • The primary sink for atmospheric CH4 is reaction with OH radicals in the atmosphere. CH4 + OH• CO2 + H2O • Currently, CH4 has a ~10 year lifetime (t) in atmosphere. • Methane is a reactive gas in the atmosphere, in contrast to CO2 which is a non-reactive gas.
Methane as Climate Indicator • Source strength depends on extent of wet soil conditions (opposite of aridity) • Extent of wet soils controlled primarily by precipitation rates and patterns (climate). • In cold (tundra) regions, temperature likely has major role on CH4 emission strength. • The ocean has small role in the CH4 cycle (in contrast to CO2).
Atmospheric Methane from Antarctic Ice Cores CH4 concentration doubles between glacial and interglacial conditions CH4 changes correlate strongly with temperature changes
Methane as Climate Indicator • Higher methane levels during interglacial times, suggests that the earth was generally wetter (higher precipitation) than during glacial times, which increased the spatial extent of flooded soils and, in turn, the biogenic production rate of methane and its concentration in the atmosphere. • Not clear whether this increase in precipitation was global or regionally specific (e.g., role of monsoons?).Where did increased methane production occur (tropics, temperate, polar latitudes)? • Methane concentration in atmosphere contributes to overall greenhouse gas effect.
Atmospheric Carbon Dioxide (CO2) • Dominant greenhouse gas that has played a key role in changing the earth’s climate in the past (e.g., Snowball Earth, Cretaceous Hothouse). • What can we learn about the role of atmospheric CO2 as a climate factor from the oscillations in CO2 that occurred over the last 700K years?
CO2 gas concentration in the atmospheric Atmospheric CO2 levels increase by 40% between glacial (~200 ppm) and interglacial (~280 ppm) times. Strong correlation between CO2 and temperature changes in ice cores.
Atmospheric CO2 and Ice Volume Records • - Atmospheric CO2 record from ice cores • Ice volume record from d18O of marine CaCO3 sediments • What is implication of strong correlation?
What causes the Glacial-Interglacial shifts in atmospheric CO2? • Involves a change in the earth’s carbon cycle. • Very likely that this change involved the ocean. • Recent evidence points the finger at changes in circulation of the Southern Ocean.
Carbon Reservoir Changes and Exchange Rates Changes in Reservoir Sizes (Pg, %) between Interglacial and Glacial Carbon Exchange Rates (Pg/yr) Deep Ocean accumulates the carbon lost from the atmosphere and land biota during glacial times.
Ocean-Atmosphere CO2 System • There is much more CO2 in the ocean (38,000 Pg C) compared to the atmosphere (600 Pg C). • Thus the concentration of CO2 in the ocean controls the concentration of CO2 in the atmosphere. key reaction: CO3= + CO2 + H2O 2HCO3- • Air-sea CO2 gas exchange is the process that links the CO2 concentrations in the atmosphere and ocean.
d13C as a Tracer of Changes in the Earth’s Carbon (CO2) Cycle Size and d13C (‰) of C Reservoirs d18O and d13C in CaCO3 Sediments d13C (‰)= [(13C/12C)sample/(13C/12C)standard – 1)*1000 (Standard = PDB carbonate)
Correlation between d13C and d18O changes in CaCO3 Record Benthic = open circle Pelagic = filled circle Ocean d13C is lower during Glacial versus Interglacial conditions
Using d13C as a Carbon Cycle Tracer • Changes in the d13C of the ocean CaCO3 record indicate that there was a significant change in the earth’s carbon cycle during Glacial vs Interglacial times. • The d13C of CaCO3 in benthic forams decreased by ~ -0.3 to -0.4 ‰ (from Ruddiman) during glacial times. • If this glacial ocean d13C decrease was the result of a transfer of terrestrial organic carbon to the ocean, we can calculate how much carbon was transferred using d13C. (How was it transferred?)
Quantify the Amount of Terrestrial Carbon Transferred to Ocean • Carbon Mass and Isotope Budget Interglacial Ocean Carbon + Terrestrial Carbon Added = Glacial Ocean Carbon (38,000 PgC) (0 ‰) + (Terr C added) (-25 ‰) = (38000+ Terr C added)(-0.35 ‰) • Terrestrial Carbon added = 524 Pg C -Terrestrial Carbon Reservoir = 2100 Pg C • This estimate roughly agrees with estimates based on the loss of vegetation and soils during the growth of continental ice sheets.
Effect on Atmospheric CO2 • What effect will this ocean inorganic carbon increase have on atmospheric CO2 concentrations? -increases CO2 in the atmosphere (~ 15 ppm) • (Remember: ocean CO2 controls atmospheric CO2) • This is opposite to the trend observed in ice cores Interglacial CO2 = 280 ppm Glacial CO2 = 190 ppm • Some other change in Earth’s carbon cycle caused lower CO2 levels during Glacial times.
Why was the atmospheric CO2 concentration lower by ~90 ppm during glacial compared to interglacial times? • It’s very likely that the mechanism lies in the ocean since the ocean has the biggest carbon reservoir active on relevant time scales and surface ocean CO2 controls atmospheric CO2. • It is likely a combination of physical, biological and chemical changes to the ocean that cause the CO2 level in the ocean (and thus atmosphere) to change. • Recent evidence (2009) indicates that the Southern Ocean is the key region.
Mechanism: Change CO2 Solubility in Seawater • CO2 gas solubility depends inversely on temperature • Increases by ~4% per 1ºC cooling • Cool surface ocean by 2.5 ºC lowers pCO2 by –22 ppm • CO2 gas solubility depends inversely on salinity • Increase salinity by ~ 1 ppt increases pCO2 by ~11 ppm (Why does ocean salinity increase during Glacial times? Net Effect: – 11 ppm
Mechanism: Make the Surface Ocean More Alkaline during Glacial Times • Key Reaction: CO2 + H2O + CO3= 2 HCO3- -an increase in CO3= concentration will decrease CO2 • Change CO3= by changing the ratio of biological organic carbon (CH2O) to CaCO3 production and sedimentation -if diatoms were favored over forams during glacial times there would be less CaCO3(s) production and an increase in CO3= concentration (iron supply favors diatoms) • Change CO3= by increasing supply of CO3= ion to the surface of Southern Ocean by a change in ocean circulation rates and/or pathways
Mechanism: Ocean Circulation • Increasing the circulation (exchange) rate between deep ocean and surface ocean affects surface ocean CO2 levels by two processes. • Increased mixing brings up deep water with high CO2 concentrations to the surface ocean. This increases CO2 levels in surface ocean. • However, at the same time increased mixing brings deep water with high nutrients which stimulates photosynthesis. This decreases CO2 levels in surface ocean. • Where does most of this surface-deep ocean exchange occur? Which effect wins out?
Mechanism: Increase the Ocean’s Photosynthesis Rate during Glacial Times • Photosynthesis consumes CO2 CO2 + H2O CH2O (sugar) + O2 • Currently there are a lot of nutrients in the surface waters of the Southern Ocean that could be utilized • Hypothesis: Increase supply rate of iron to the ocean -iron is a trace nutrient that plankton need and is thought to limit photosynthesis rates in the Southern Ocean “Give me half a tanker of iron, and I’ll give you the next Ice Age” (John Martin, ~1990)
Current Distribution of Photosynthesis in the Ocean estimated from Satellite Data
Current Distribution of Nitrate in Surface Pacific Ocean Purple = high nitrate Green = low nitrate Unused nutrients in Southern Ocean
Increase in Dust in Ice Cores Prior to Glacial to Interglacial Transition 20K yrs 130K yrs Link: Dust contains iron.
Possible Ocean Photosynthesis effects on atmospheric CO2 Current CO2 Level - photosynthesis has the potential to cause ocean and, thus, atmospheric CO2 changes
What effect would these ocean changes have on atmospheric pCO2? - pCO2 (Glacial) = 190ppm pCO2 (Interglacial) = 280 ppm (Qualitative)
Ice Core Records over last 750K years • Critical climate record: • air temperature • atmospheric gas concentrations (CO2, CH4, N2O, O2) • Dust (iron supply?) • Marine aerosols • What do ice core records tell us about links between temperature change and forcing? • What do ice core records tell us about sequence of climate events during transition from glacial to interglacial conditions?
Ice Core Records from Vostok,Antarctica Repeating ‘sawtooth’ patterns. Why? Consistent limits for temp and gases. Why? Petit et al., 1999 (Petit et al., 1999)
Termination II at 120K yrs Glacial Terminations What was sequence of climate events that ended glacial eras? What about gas age vs ice age offset?