Download
1 / 68
680 likes | 827 Vues
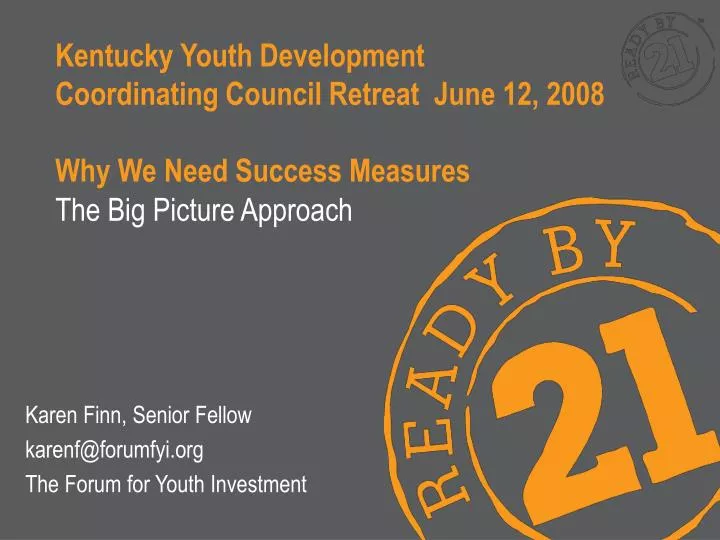
Kentucky Youth Development Coordinating Council Retreat June 12, 2008 Why We Need Success Measures. The Big Picture Approach. Karen Finn, Senior Fellow karenf@forumfyi.org The Forum for Youth Investment. The American DREAM. All youth can be ready . Every family and community

E N D
Kentucky Youth Development Coordinating Council Retreat June 12, 2008Why We Need Success Measures The Big Picture Approach Karen Finn, Senior Fellow karenf@forumfyi.org The Forum for Youth Investment
The AmericanDREAM Allyouth can be ready. Everyfamily and community can be supportive. Eachleader can make a difference.
The American REALITY Too FewYouth are Ready.Only 4 in 10 are doing well. Too FewFamilies and Communities are Supportive. Fewer than 2 in 5 youth have the supports that they need. Too Feware Trying to Make a Difference.
The AmericanDILEMMA At a time when“Failure is NOT an Option” (The Hope Foundation)and“Trying Hard is NOT Good Enough”(Mark Friedman) THE GAP BETWEENVISION AND REALITYHAS TO BE CLOSED
The American DILEMMA • Fragmentation • Complacency • Low Expectations of Youth, Communities and Leaders
Business as Usual… See a Problem, Convene a Task Force, Create a Program…Has Created a Tangle of Inefficiencies Children’s Services in Los Angeles County SOURCE:Margaret Dunkle
Even the smallest communities have too many initiatives Civic Engagement Physical Health Delinquency & Violence Pregnancy & HIV/AIDS Core Supports & Opportunities Dropouts & Illiteracy Educational Attainment Unemployment Vocational Readiness & Success Substance Abuse, Suicide, Depression Social & Emotional Health
The Ready by 21 Challenge: Changing the Odds for Youth by Changing the Way We Do Business Change the oddsfor youth Change the waywe do business Change the landscapeof communities
Identifying Shared Outcomes and Indicators Change the oddsfor youth Change the landscapeof communities Change the waywe do business
Changing the Way We Do Business Think Differently so that together we can Act Differently
Changing the Way We Do Business Think Differently BIG PICTURE APPROACH so that together we can Act Differently
SET BIGGER GOALS BE BETTER PARTNERS USE BOLDER STRATEGIES Changing the Way We Do Business Think Differently BIG PICTURE APPROACH so that together we can Act Differently
Changing the Odds for Youth . . . WANTED: Young People Who are Ready
Are they Ready? Change the oddsfor youth Change the landscapeof communities Change the waywe do business
In the Middle 35% Doing Well 43% Doing Poorly 22% Too Few Young People are Ready Researchers Gambone, Connell & Klem (2002) estimate thatonly 4 in 10 are doing wellin their early 20s. 22% are doing poorly in two lifeareas and not well in any • Productivity: High school diploma or less, are unemployed, on welfare • Health: Poor health, bad health habits, unsupportive relationships • Connectedness: Commit illegal activity once a month 43% are doing well in two lifeareas and okay in one • Productivity: Attend college, work steadily • Health: Good health, positive health habits, healthy relationships • Connectedness: Volunteer, politically active, active in religious institutions, active in community
We Know What it Takes to Support Development • The National Research Council reports that teens need: • Physical and Psychological Safety • Appropriate Structure • Supportive Relationships • Opportunities to Belong • Positive Social Norms • Support for Efficacy and Mattering • Opportunities for Skill-Building • Integration of Family, School and Community efforts
Do these Supports Really Make a Difference? Even in Adolescence? ABSOLUTELY Gambone and colleagues show that youth with supportive relationships as they enter high school are5 times more likelyto leave high school “ready” than those with weak relationships… SOURCE: Finding Out What Matters for Youth: Testing Key Links in a Community Action Framework for Youth Development
Do these Supports Make a Difference in Adulthood? … and those seniors who were “ready” at the end of high school were more than4 times as likelyto be doing well as young adults. SOURCE:Finding Out What Matters for Youth: Testing Key Links in a Community Action Framework for Youth Development
. . . by Changing the Landscape of Family and Community Supports NEEDED: Coordinated & High Quality Supports
Are They Getting the Supports They Need? Change the oddsfor youth Change the landscapeof communities Change the waywe do business
13% 25% 50% 45% 37% 30% 12 – 17 Years Old 6 – 11 Years Old One third of 6-17 year olds lack the supports they need • According to the America’s Promise Alliance National Promises Survey, only 31% of 6-17 year olds have at least 4 of the 5 promises. 21% have 1 or none. • And the likelihood of having sufficient supports decreases by age: • 37% of 6-11 year olds have at least 4 promises; 13% have 1 or none. • Only 30% of 12-17 year olds have at least 4; 25 % have 1 or none.
Reach Counts 21 . . . 0 Civic Social Emotional Physical Vocational Cognitive Outcome Areas ? Ages ? ? School After School Morning . . . Night At its best, school only fills a portion of developmental space Times of Day
Who is Responsible for the Rest? ? • Families • Peer Groups • Schools and Training Organizations • Higher Education • Youth-Serving Organizations • CBOs (Non-Profit Service Providers and Associations) • Businesses (Jobs, Internships and Apprenticeships) • Faith-Based Organizations • Libraries, Parks, and Recreation Departments • Community-Based Health and Social Service Agencies
There is basic agreement that young people who participate fully in school and programs and their communities have better outcomes than those who do not. Consequently there is increased interest in getting inside the black box -- mapping the program landscape what is available to whom, when, where, why, how, and how much it costs. Youth Participation Improving Program Availability isn’t Enough Youth outcomes
We Advocate for a “Big Picture Approach” The Forum couples field knowledge with conceptual, practical and “power” tools to help state and local leaders quickly organize available information (about youth outcomes, community supports and current initiatives and resources) to support data-driven “big picture” planning and accountability. • Take Aim • Take Stock • Target Action • Track Progress
Taking Aim Outcomes and Indicators
DEFINITIONS RESULT or OUTCOME: A condition of well-being for children, adults, families or communities. Children born healthy, Children succeeding in school, Safe communities, Clean Environment, Prosperous Economy INDICATOR A measure which helps quantify the achievement of a result. Rate of low-birthweight babies, Rate of high school graduation, crime rate, air quality index, unemployment rate PERFORMANCE MEASURE A measure of how well a program, agency or service systemis working.Three types: 1. How much did we do? 2. How well did we do it? 3. Is anyone better off? = Customer Outcome
Kentucky’s Outcomes • Youth Make Healthy Choices • Youth are Life Long Learners • Youth Participate in Community Decision Making • Youth Develop Social and Emotional Competencies • Youth have Knowledge and Skills to be Productive in the 21st Century
The Kentucky Youth Development Coordinating Council - OUTCOMES • Youth Make Healthy Choices: Young people make healthy choices regarding their mental and physical health including: nutrition, physical activity, substance use and abuse, sexual activity, coping skills, stress reduction and emotional well-being.
The Kentucky Youth Development Coordinating Council - OUTCOMES • Youth are Life Long Learners Young people are successful in school and develop the skills they need throughout their life to be employable and support themselves and their family.
The Kentucky Youth Development Coordinating Council - OUTCOMES • Youth participate in Community Decision Making: Young people have meaningful roles in their schools, communities and the organizations that serve them through opportunities for decision making, leadership and service.
The Kentucky Youth Development Coordinating Council - OUTCOMES • Youth Develop Social and Emotional Competencies : Young people develop the skills they need for healthy relationships and they experience healthy relationships in their lives.
The Kentucky Youth Development Coordinating Council - OUTCOMES • Youth Have Knowledge and skills to be productive in the 21st Century : Young people have the skills necessary to be self sufficient and successful in our global economy.
Selecting Indicators • Balanced set of indicators: • Across outcome areas • Across ages • Across populations • Across a range of goals and approaches • That have strong: • Communication Power • Proxy Power • Data Power
Take Aim on the Big PictureHow are Young People Doing? High school failure doesn’t occur in a vacuum… and high school completion doesn’t ensure adult success.
H M L The Matter of Baselines OK? Point to Point Turning the Curve Forecast History Baselines have two parts: history and forecast
Maryland Ready by 21 Action Agenda Indicators: Desired Results: Ready for college Ready for work Ready for Life Action Areas:
Maryland Ready by 21 Action Agenda Indicators: • Educational attainment • Employment • Health Care Coverage • HIV/AIDS rate • Deaths by Injury rate • Arrests Desired Results: Ready for college Ready for work Ready for Life Action Areas:
Maryland Ready by 21 Action Agenda Indicators: • Educational attainment • Employment • Health Care Coverage • HIV/AIDS rate • Deaths by Injury rate • Arrests Desired Results: Ready for college Ready for work Ready for Life Action Areas: Competent, Caring Adults Accessible, Affordable Housing Access to Health Care Pathways to Education and Employment Equal Treatment Under the Law
Maryland Ready by 21 Action Agenda Indicators: • Educational attainment • Employment • Health Care Coverage • HIV/AIDS rate • Deaths by Injury rate • Arrests Desired Results: Ready for college Ready for work Ready for Life Action Areas: Competent, Caring Adults Accessible, Affordable Housing Access to Health Care Pathways to Education and Employment Equal Treatment Under the Law
Maryland Ready by 21 Action Agenda Indicators: • Educational attainment • Employment • Health Care Coverage • HIV/AIDS rate • Deaths by Injury rate • Arrests Desired Results: Ready for college Ready for work Ready for Life Action Areas: Competent, Caring Adults Accessible, Affordable Housing Access to Health Care Pathways to Education and Employment Equal Treatment Under the Law
Maryland Ready By 21TM Action Agenda • What results do you want for youth? • What indicators do you have access to? • What contributing factors (the story behind) are impacting these indicators? • How do these cluster? Developed action areas • What are a balanced, integrated set of strategies and action steps in each area? Who is doing what?? • What are the “Moving Trains” and “Standing Bodies” that can be linked to? • Constantly cross checking these pieces against the big picture results and analyzing them against what we know is needed to make change
Maryland’s Ready by 21 Action Agenda POPULATION LEVEL GOALS ACTION AREAS DESIRED OUTCOMES How is our community doing? How are our young people doing? Competent, Caring Adults Accessible, Affordable Housing Access to Health Care Pathways to Education and Employment Equal Treatment Under the Law Ready for College, Work & Life As measured by indicators e.g., educational attainment, employment, health care coverage, HIV/AIDS rate… Program/System Level Performance QUALITY How well do we do it? PROGRAM OUTCOMES Is anyone better off? PARTICIPATION How much do we do? Frequency, duration, intensity of participation Point of Service Quality Improved skills, knowledge & behaviors
Percentage of the Five America’s Promises that Kentucky Program Outcomes Address
Number of the Five Promises that Each Kentucky Program Pursues
Lead and mentor Be in small groups Partner with adults Experience belonging Encouragement Reframing conflict Skill building Session flow Active engagement Welcoming atmosphere Psychological and emotional safety Program space and furniture Emergency procedures Healthy food and drinks Physically safe environment Point of Service Quality and the YPQA Plan Makechoices Engagement Reflect Interaction Supportive Environment Safe Environment
Take Stock of Public and Private Community SupportsUsing a Common Set of Performance Measures