Download
1 / 34
340 likes | 344 Vues
This document provides an overview of data flow and products, data review procedures, periodic reviews, and documentation for the OOI. It also discusses the next steps and conclusions of the 2018 Early Career Workshops.

E N D
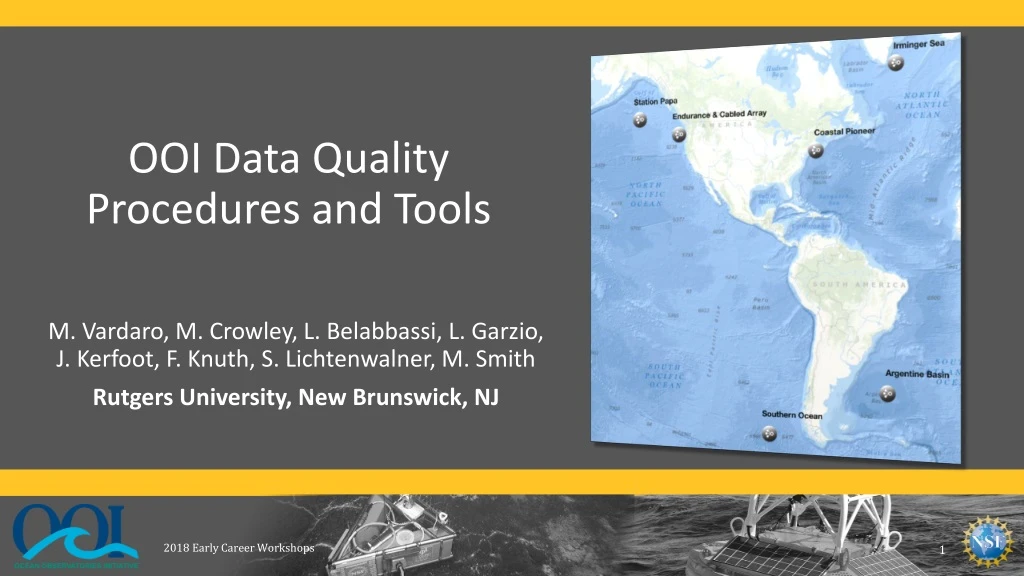
OOI Data Quality Procedures and Tools M. Vardaro, M. Crowley, L. Belabbassi, L. Garzio, J. Kerfoot, F. Knuth, S. Lichtenwalner, M. Smith Rutgers University, New Brunswick, NJ 2018 Early Career Workshops
Overview Data Flow & Products Data Review Procedures Periodic Reviews & Documentation Next Steps Conclusions 2018 Early Career Workshops
OOI By the Numbers 7 57 31 1227 >2500 >100K 4.5Data Evaluators Arrays Stable Platforms Moorings, Profilers, Nodes Mobile Assets Gliders, AUVs Instruments (~850 deployed) Science Data Products Science/Engineering Data Products 2018 Early Career Workshops
Data Flow Chart 2018 Early Career Workshops Data types: Telemetered Data Recovered Data Streamed Data Shipboard Data Metadata(CF 1.6) Data product levels: Raw, L0, L1, L2
OOI Data Product Levels • Raw data: The datasets as they are received from the instrument • May contain multiple L0, L1, or L2 parameters, data for multiple sensors, and be in native sensor units • Always persisted and archived by the OOI • Example: format 0 binary file from an SBE-37IM on a Global Flanking Mooring. • Level 0 (L0): Unprocessed, parsed data parameter that is in instrument/sensor units and resolution • Sensor by sensor (unpacked and/or de-interleaved) and available in OOI supported formats (e.g., NetCDF) • Always persisted and archived by the OOI • Example: SBE-37IM Temperature portion of the hex string • Level 1 (L1): Data parameter that has been calibrated and is in scientific units • Created on-demand via user synchronous or asynchronous request • Actions to transform Level 0 to Level 1 data are captured and presented in the metadata of the Level 1 data • Example: SBE-37IM Temperature converted from hex to binary and scaled to produce degrees C • Level 2 (L2): Derived data parameter created via an algorithm that draws on multiple L1 data products • Created on-demand via user synchronous or asynchronous request • Products may come from the same or separate instruments; data from all instruments are provided during download • Example: SBE-37IM Density and Salinity 2018 Early Career Workshops
OOI Data Status • All available telemetered and recovered data are being ingested and made accessible for download** • Rutgers CI currently storing >340TB of raw data, including ~100 TB HD video (so video ≈ 30% of total data) ~150TB are publicly available via the raw data archive ~14TB of processed data ready for product generation • All known issues have been annotated. Unless otherwise remarked, the data have not been validated against in situsamples taken by instrumentation external to the system. 2018 Early Career Workshops
Overview Data Flow & Products Data Review Procedures Periodic Reviews & Documentation Next Steps Conclusions 2018 Early Career Workshops
Data Team Primary Goals Monitor the operational status of data flowing through the OOI system Ensure the availability of OOI datasets in the system (raw, processed, derived, and cruise) Ensure that data delivered by the system meets quality guidelines Report operational statistics on data availability, data quality, and issue resolution 2018 Early Career Workshops
Data Team Tasks CI Data Review Environmental and Raw Data Review Ingestion Helpdesk Stats Data Team Portal UI Testing ERDDAP Answer Questions Data Availability Timelines Download Plot Check Data Build Ingest Automation TestFixes and New Features Run Raw in Vendor Software Set up Back End Monitor Raw Data Delivery Make Annotations Set up Recurring Ingestion Instrument Pages Display Daily Stats Monitor Real-time Ingestion Compare to CI Output Suggest New UI Features Set up Front End Ingest Missing Data Tutorials Create Data Issue Tickets Processes Environmental Data Ingest Data Create UI Issue Tickets Parse MIO Operational Stats Compare to CI Output Workshops Conferences Publications Asset Mgmt Updates Produce Daily Resolution Fix QC Algorithms 2018 Early Career Workshops
First in Class Reviews: Jan-Aug 2016 • One example of each data stream (ingestion completed by Systems team) • Review of 1207 (467 science) streams completed in August 2016 • Tested parsers, algorithms, ingestion, asset management and data product creation 2018 Early Career Workshops
Data Annotation • Annotations are the primary means of communication between data team and users • Annotations can be directly entered via the GUI for specified data streams • Annotation text appears in a tab on the data catalog/plotting page • Annotation time ranges can be shown on plots (via “Options” interface) • Annotations also included in downloaded data 2018 Early Career Workshops
Rest in Class Data Review Workflow • Visual Assessment • Data Availability • Data Quality Investigate Gaps and QC failures Plot Data File M2M Request Summary Report • Annotate in GitHub • Subsite – Operational Status • Node – Operational Status • Instrument – Operational Status • Stream - Availability • Parameter – Quality & Availability Automated tests • Parameter Level • Global range • Stuck Value • Spike Test • Fill values • NaNs • Gap Check • Instrument Level • Deployment time range • Stream Level • Start and End Date • Lat/Lon • Duplicate Timestamps • Parameter Availability Push to System 2018 Early Career Workshops
OOI Automated QC Procedures • 6automated QC algorithms can produce 7 flags (including logical “or” which combines flags) which are plottable and are included in downloaded files • Coded based on specifications written by OOI Project Scientists, derived from QARTOD manuals and other observatory experiences • Algorithms refer to “lookup tables” assembled by OOI Project Scientists with input from subject matter experts: https://github.com/ooi-integration/qc-lookup Global Range Test Local Range Test Spike Test Stuck Value Test Trend Test Temporal Gradient Test Spatial Gradient Test(Profile) 2018 Early Career Workshops
QARTOD/OOI QC Comparison 2018 Early Career Workshops
NetCDF QC flags NOTE: Results of the QC tests do not remove data. • Each parameter in a file has a corresponding *_qc_executed and *_qc_resultsvariable • qc_executed indicates which tests were run • qc_results denotes which tests passed • Integer values can be converted to a binary that indicates which tests were run (1) or not (0), and which passed (1) or failed (0). • See example QC Python notebook or online guide (http://oceanobservatories.org/knowledgebase/interpreting-qc-variables-and-results/) for more details. 2018 Early Career Workshops
Rest in Class Data Status Categories 2018 Early Career Workshops
Overview Data Flow & Products Data Review Procedures Periodic Reviews & Documentation Next Steps Conclusions 2018 Early Career Workshops
Examples of Reviews and Reporting Annotation Text Quality Timeline 2018 Early Career Workshops
QC Database Tool • Used for reference & statistics • Includes status information, as well as a cruise data checklist • Includes testing/review capability • Annotation options • http://ooi.visualocean.net 2018 Early Career Workshops
Examples of QC Effort Pressure offsets (Bad calvalues) Drift Biofouling Damage Video issues 2018 Early Career Workshops
Deliverables • Data Availability Reports • (% completeness, streams/parameters reported, particles in the system) • Data Quality Reports • Redmine reporting • Issues found, investigations, and Help Desk open/closed • Deep dive investigation reports • Annotations (to users) • Download statistics 2018 Early Career Workshops
Data Evaluation Daily Activities • Review the end-to-end operational status of online instruments and investigate any outages (e.g. instrument, telemetry, parsing, or ingestion failures). • Review the operational status of other data archives (raw, cruise, ERDDAP) • Look into and resolve new system alerts** • Follow up on any issue requests from users (via Redmine) • Add annotations to notify users of operational status changes 2018 Early Career Workshops
Daily Review Workflow = Questions = Actions = Decision points 2018 Early Career Workshops
Overview Data Flow & Products Data Review Procedures Periodic Reviews & Documentation Next Steps* Conclusions 2018 Early Career Workshops
Data Availability and Completeness • Some derived data products are still being added to the system • Some products are available but do not show up in data catalog or cannot be plotted • Some products require additional processing (e.g. ZPLSC, HYDBB) Seafloor Uplift and Deflation Mean Depth(BOTSFLU L2) Seafloor Uplift and Deflation 5-min Rate of Depth Change (BOTSFLU L2) Seafloor Uplift and Deflation 10-min Rate of Depth Change (BOTSFLU L2) 2018 Early Career Workshops
QC Challenges & Solutions • Local range values need statistical analysis of environmental data for each platform • Need to work with SMEs to analyze and apply ranges and test algorithm • Trend test may not work as designed, because it requires the system to compare data prior to the user request date – analysis ongoing • Gradient test is complicated to apply, requires 2D dataset – analysisongoing • Spike test is currently very simple - needs tweaking to avoid false positives/negatives (especially in biological data) and to work with certain data types • Not all QC algorithms apply to all data products – ongoingreviewwithSMEs • The QC algorithms do NOT trigger alerts in the system - Alerts/alarms only trigger when new data is telemetered/streamed • Can set alerts on L1/L2 data streams based on Global/Local range values 2018 Early Career Workshops
CI Priorities (through Sept 2018) Data product creation: Hydrophone data, Osmosampler, pCO2 Flux, VADCP, interpolation issues Data discovery: navigation of data catalog, missing pressure data, image galleries, stream name consistency User experience: login fixes, interpolated plots, data download issues (missing status, provenance errors), status indicators and dashboard, addition of multiple-stream download Quality control: data displayed outside deployment time range, QC lookup values, fill value support, improved annotations 2018 Early Career Workshops
Overview Data Flow & Products Data Review Procedures Periodic Reviews & Documentation Next Steps Conclusions 2018 Early Career Workshops
Conclusions • A large amount of high quality data has been and continues to be collected, with high science value • Data review is our primary focus, given maturation of the system and control over data ingestion • Data team accelerating review via development of specialized tools • Short-term goals for improving data quality and delivery (medium- and long-term goals are in flux) • OOI is providing a curated, consistent data system delivering data and metadata to the community • Trust, but verify! 2018 Early Career Workshops
Rutgers Data Team Mike Vardaro Sage Lichtenwalner John Kerfoot Mike Crowley Lori Garzio Friedrich Knuth Mike Smith Leila Belabassi 2018 Early Career Workshops
Questions? • OOI Main Web site:http://oceanobservatories.org • Data Portal: http://ooinet.oceanobservatories.org Help Desk: help@oceanobservatories.org Mike Vardaro, Data Manager, OOI CI Data Team vardaro@marine.rutgers.edu Mike Crowley, Program Manager, OOI CI Data Team crowley@marine.rutgers.edu Acknowledgements: NSF, COL, Rutgers University, University of Washington, WHOI, Oregon State University, Raytheon 2018 Early Career Workshops
Science Evaluation: Are ocean features encountered real? Outside local range Is this real? Taking advantage of all assets, even non-NSF, to assess data quality IOOS data shows presence of warm core ring IOOS data shows ocean response to storm 2018 Early Career Workshops
Adding capability to OOINet experience 2018 Early Career Workshops
Vicarious Calibration - Comparisons enabled by ERDDAP Glider 387 Comparison Segment Concurrent profiles from Glider 387 and Coastal Pioneer Profiler Mooring Co-located and concurrent Temperature and Salinity Profiles Blue – Glider 387Red – Coastal Pioneer Profiler Mooring 2018 Early Career Workshops