Download
1 / 24

E N D
1. NOP � December 10, 2002
Released DEIR � November 10, 2003
Certified FEIR � February 8, 2005
NOP � December 10, 2002
Released DEIR � November 10, 2003
Certified FEIR � February 8, 2005
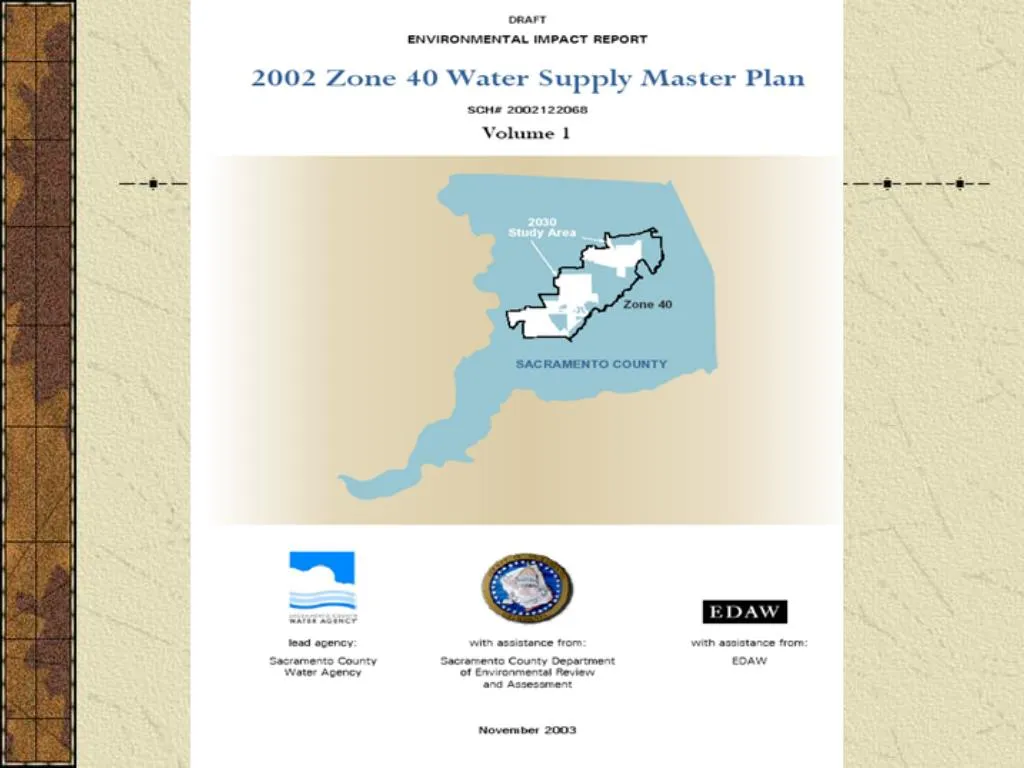
2. Zone 40 WSMP EIR This presentation will focus on the approach used in the EIR to evaluate effects of the proposed WSMP on the Central Groundwater Basin and Cosumnes River flow.
www.dera.saccounty.net Power Point presentation and Final EIR is available at the DERA web site
address shown on this slide.
While there were many other environmental issues, such as growth inducement, land use, air quality, noise and other discussed in the FEIR, the focus of this presentation relates only to the environmental issues related to the Central Ground water Aquifer and Cosumnes River Flows. Power Point presentation and Final EIR is available at the DERA web site
address shown on this slide.
While there were many other environmental issues, such as growth inducement, land use, air quality, noise and other discussed in the FEIR, the focus of this presentation relates only to the environmental issues related to the Central Ground water Aquifer and Cosumnes River Flows.
3. Ground water levels in Sacramento County have been measured since early 1900, with monitoring occurring at about 130 locations in the Central Basin Aquifer. Typically, the monitoring data is used to prepare Spring or Fall isopleths of ground water elevations. At the time we began the EIR studies for the Zone 40 WSMP, the latest groundwater contour was for the Spring of 2000. Since measuring began, the groundwater elevation had declined more than 100 feet, for an average decline of about 1 � feet per year since about 1940.
Ground water levels in Sacramento County have been measured since early 1900, with monitoring occurring at about 130 locations in the Central Basin Aquifer. Typically, the monitoring data is used to prepare Spring or Fall isopleths of ground water elevations. At the time we began the EIR studies for the Zone 40 WSMP, the latest groundwater contour was for the Spring of 2000. Since measuring began, the groundwater elevation had declined more than 100 feet, for an average decline of about 1 � feet per year since about 1940.
4. This is the Spring 2000 groundwater contour for Sacramento County. The Central Basin had a cone of depression of depression near western Elk Grove. The center of the cone at is about -60 feet MSL, approximate 100 feet below the ground surface. The Zone 40 area occupies slightly less that 30 % of the central basis area. This is the Spring 2000 groundwater contour for Sacramento County. The Central Basin had a cone of depression of depression near western Elk Grove. The center of the cone at is about -60 feet MSL, approximate 100 feet below the ground surface. The Zone 40 area occupies slightly less that 30 % of the central basis area.
5. Existing Conditions Useful for context, but not really meaningful for comparative analysis.
The CEQA 2000 baseline is not the 2000 measured condition as portrayed on the Spring Groundwater Elevation Contour Map.
The existing ground water elevation show where the aquifer was in 2000. But conditions were changing up when the measurement were made and would continue to change after the measurements were made regardless if the Zone 40 WSMP was approved. The existing ground water elevation show where the aquifer was in 2000. But conditions were changing up when the measurement were made and would continue to change after the measurements were made regardless if the Zone 40 WSMP was approved.
6. Determining A Baseline From Which To Compare ZONE 40 WSMP Impacts A baseline needed to be established to which future conditions could be compared.
This baseline represents the long term effect of water demand and supply conditions at the 2000 level of development held constant for the 74-year period of known hydrology. What we did to establish a comparable base line was to �freeze� in time 2000 year conditions. What we did to establish a comparable base line was to �freeze� in time 2000 year conditions.
7. The 2000 Baseline Condition within Zone 40 assumes the following:
Land use (urban and agricultural acreage) is based on the DWR 2000 (most recent) land use survey.
Urban demands are estimated based on the 2000 land use survey, Boyle Engineering Corporation (1995) unit water use factors modified to reflect more recent water use data that support a 12% level of conservation.
Agricultural demands are estimated based on crop type and the DWR 2000 crop acreages.
Surface water supplies are limited to those currently in place, and are simulated based on the DWR/USBR model CALSIM II 2000 Baseline Condition.
Groundwater pumping is used to meet most of the demands in
Zone 40.
There is no reuse of remediated water extraction as source of water supply Methodology These are the variables that were locked in at the year 2000 condition. These are the variables that were locked in at the year 2000 condition.
8. The SCISGM used selected hydrograph locations to represent modeled groundwater conditions throughout the Central Basin.
Test 3 pumping distriburion locations to determine which had least effect on Basin aquifer.
North or South concentration and evenly distributed, Zone 40 WSMP option The SCISGM used selected hydrograph locations to represent modeled groundwater conditions throughout the Central Basin.
Test 3 pumping distriburion locations to determine which had least effect on Basin aquifer.
North or South concentration and evenly distributed, Zone 40 WSMP option
10. The results from the model appeared as variable line over time. The high being spring and the low being fall.The results from the model appeared as variable line over time. The high being spring and the low being fall.
11. Results of hydrographs were used to create a 2000 baseline simulated groundwater contour map. Results of hydrographs were used to create a 2000 baseline simulated groundwater contour map.
12. Developing the 2030 Scenarios 2030 groundwater scenarios were developed by applying planned and expected land use changes, water demands and other variables to the 74-year period of hydrologic record. Just like we did for the 2000 condition.Just like we did for the 2000 condition.
13. 2030 Alternatives Location of pumping � north, south, even distribution.
Groundwater remediation � various.
Cosumnes River flow enhancement
We tested the even distribution because it affected the central basis the leastWe tested the even distribution because it affected the central basis the least
14. Groundwater Effects 2030 total pumping less than Water Forum 273,000 afy recommended sustainable yield.
With recycled water returned to basin for beneficial useWith recycled water returned to basin for beneficial use