Download

1 / 74
860 likes | 1.16k Vues
Chapter 9: Systems of Equations and Inequalities; Matrices. 9.1 Systems of Equations. A set of equations is called a system of equations . The solutions must satisfy each equation in the system. A linear equation in n unknowns has the form where the variables are of first-degree.

E N D
9.1 Systems of Equations • A set of equations is called a system of equations. • The solutions must satisfy each equation in the system. • A linear equation in n unknowns has the form where the variables are of first-degree. • If all equations in a system are linear, the system is a system of linear equations, or a linear system.
9.1 Linear System in Two Variables • Three possible solutions to a linear system in two variables: • One solution: coordinates of a point, • No solutions: inconsistent case, • Infinitely many solutions: dependent case.
9.1 • Characteristics of a system of two linear equations in two variables.
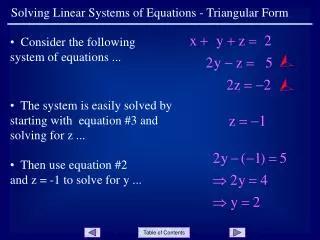
9.1 Substitution Method Example Solve the system. Solution (1) (2) Solve (2) for y. Substitute y = x + 3 in (1). Solve for x. Substitute x = 1 in y = x + 3. Solution set: {(1, 4)}
9.1 Solving a Linear System in Two Variables Graphically Example Solve the system graphically. Solution Solve (1) and (2) fory. (1) (2)
Solve using the method of graphing. x2 + y2 = 25 x2 + y = 19
Solving a Nonlinear System of Equations Example Solve the system. Solution Choose the simpler equation, (2), and solve for y since x is squared in (1). Substitute for y into (1) . (1) (2)
Solving a Nonlinear System of Equations Substitute these values for x into (3). The solution set is
9.2 Elimination Method Example Solve the system. Solution To eliminate x, multiply (1) by –2 and (2) by 3 and add the resulting equations. (1) (2) (3) (4)
9.2 Elimination Method Substitute 2 for y in (1) or (2). The solution set is {(3, 2)}. Consistent System
Solving an Inconsistent System Example Solve the system. Solution Eliminate x by multiplying (1) by 2 and adding the result to (2). Solution set is . (1) (2) Inconsistent System
Solving a System with Dependent Equations Example Solve the system. Solution Eliminate x by multiplying (1) by 2 and adding the result to (2). Consistent & Dependent System Solution set is all R’s. (1) (2)
9.3 Graphing Systems of Inequalities
Look at the two graphs. Determine the following: A. The equation of each line. B. How the graphs are similar. C. How the graphs are different. • The equation of each line is y = x + 3. • The lines in each graph are the same and represent all of the solutions to the equation y = x + 3. • The graph on the right is shaded above the line and this means that all of these points are solutions as well.
Inequalities with Greater Than Point: (-4, 5) Pick a point from the shaded region and test that point in the equation y = x + 3. This is incorrect. Five is greater than or equal to negative 1. If a solid line is used, then the equation would be 5 ≥ -1. If a dashed line is used, then the equation would be 5 > -1. The area above the line is shaded.
Inequalities with Less Than Point: (1, -3) Pick a point from the shaded region and test that point in the equation y = -x + 4. This is incorrect. Negative three is less than or equal to 3. If a solid line is used, then the equation would be -3 ≤ 3. If a dashed line is used, then the equation would be -3 < 3. The area below the line is shaded.
Graphing Linear Inequalities • Write the inequality in slope-intercept form. • Use the slope and y-intercept to plot two points. • Draw in the line. Use a solid line for less than or equal to () or greater than or equal to (≥). Use a dashed line for less than (<) or greater than (>). • Pick a point above the line or below the line. Test that point in the inequality. If it makes the inequality true, then shade the region that contains that point. If the point does not make the inequality true, shade the region on the other side of the line. • Systems of inequalities – Follow steps 1-4 for each inequality. Find the region where the solutions to the two inequalities would overlap and this is the region that should be shaded.
Example y x Graph the following linear system of inequalities. Use the slope and y-intercept to plot two points for the first inequality. Draw in the line. For use a solid line. Pick a point and test it in the inequality. Shade the appropriate region.
Example y x Graph the following linear system of inequalities. The region above the line should be shaded. Now do the same for the second inequality.
Example y x Graph the following linear system of inequalities. Use the slope and y-intercept to plot two points for the second inequality. Draw in the line. For < use a dashed line. Pick a point and test it in the inequality. Shade the appropriate region.
Example y x Graph the following linear system of inequalities. The region below the line should be shaded.
Example y x Graph the following linear system of inequalities. The solution to this system of inequalities is the region where the solutions to each inequality overlap. This is the region above or to the left of the green line and below or to the left of the blue line. Shade in that region.
You Try It Graph the following linear systems of inequalities.
Problem 1 y x Use the slope and y-intercept to plot two points for the first inequality. Draw in the line. Shade in the appropriate region.
Problem 1 y x Use the slope and y-intercept to plot two points for the second inequality. Draw in the line. Shade in the appropriate region.
Problem 1 y x The final solution is the region where the two shaded areas overlap (purple region).
Sect. 9.4 Linear Programming Goal 1 Find Maximum and Minimum values of a function Goal 2 Solve Real World Problems with Linear Programming
When graphing a System of Linear Inequalities * Each linear inequality is called a Constraint * The intersection of the graphs is called the Feasible Region * When the graphs of the constraints is a polygonal region, we say the region is Bounded.
Sometimes it is necessary to find the Maximum or Minimum values that a linear function has for the points in a feasible region. The Maximum or Minimum value of a related function Always occurs at one of the Vertices of the Feasible Region.
Example 1 y 4 y - x + 6 y y 6x + 4 Graph the system of inequalities. Name the coordinates of the vertices of the feasible region. Find the Maximum and Minimum values of the function f(x, y) = 3x + 2y for this polygonal region.
y 4 y - x + 6 y y 6x + 4 The polygon formed is a quadrilateral with vertices at (0, 4), (2, 4), (5, 1), and (- 1, - 2).
Use a table to find the maximum and minimum values of the function. The maximum value is 17 at (5, 1). The Minimum value is – 7 at (- 1, - 2).
Example 1 Example 2 y - 3 x - 2 y Bounded Region Graph the system of inequalities. Name the coordinates of the vertices of the feasible region. Find the Maximum and Minimum values of the function f(x, y) = 2x - 5y for this polygonal region.
The polygon formed is a triangle with vertices at (- 2, 12), (- 2, - 3), and (4, - 3) The Maximum Value is 23 at (4, - 3). The Minimum Value is – 64 at (- 2, 12).
Sometimes a system of Inequalities forms a region that is not a closed polygon. In this case, the region is said to be Unbounded.
Example 3 Unbounded Region Graph the system of inequalities. Name the coordinates of the vertices of the feasible region. Find the Maximum and Minimum values of the function f(x, y) = 4y – 3x for this region. y + 3x 4 y - 3x – 4 y 8 + x
There are only two points of intersection (- 1, 7) and (- 3, 5). This is an Unbounded Region. The Maximum Value is 31 at (- 1, 7). There is no minimum value since there are other points in the solution that produce lesser values. Since the region is Unbounded, f(x, y) has no minimum value.
Linear Programming Procedures. Step 1: Define the Variables Step 2: Write a system of Inequalities Step 3: Graph the System of Inequalities Step 4: Find the coordinates of the vertices of the feasible region. Step 5: Write a function to be maximized or minimized. Step 6: Substitute the coordinates of the vertices into the function. Step 7: Select the greatest or least result. Answer the problem.
Example 4 Ingrid is planning to start a home-based business. She will be baking decorated cakes and specialty pies. She estimates that a decorated cake will take 75 minutes to prepare and a specialty pie will take 30 minutes to prepare. She plans to work no more than 40 hours per week and does not want to make more than 60 pies in any one week. If she plans to charge $34 for a cake and $16 for a pie, find a combination of cakes and pies that will maximize her income for a week.
Step 1: Define the Variables C = number of cakes P = number of pies Step 2: Write a system of Inequalities Since number of baked items can’t be negative, c and p must be nonnegative c 0 p 0 A cake takes 75 minutes and a pie 30 minutes. There are 40 hours per week available. 75c + 30p 2400 40 hours = 2400 min. She does not want to make more than 60 pies each week p 60
Step 3: Graph the system of Inequalities cakes Pies
Step 4: Find the Coordinates of the vertices of the feasible region. The vertices of the feasible region are (0, 0), (0, 32), (60, 8), and (60, 0). Step 5: Write a function to be maximized or minimized. The function that describes the income is: f(p, c) = 16p + 34c
Step 6: Substitute the coordinates of the vertices into function. Step 7: Select the Greatest or Least result. Answer the Problem. The maximum value of the function is 1232 at (60, 8). This means that the maximum income is $1232 when Ingrid makes 60 pies and 8 cakes per week.
Section 9.5Solving Systems using Matrices • What is a Matrix? [ ] • Augmented Matrices • Solving Systems of 3 Equations • Inconsistent & Dependent Systems
Concept:A Matrix • Any rectangular array of numbers arranged in rows and columns, written within brackets • Examples:
Matrix Row Transformations • Streamlined use of echelon methods
9.5 Solution of Linear Systems by Row Transformations • This is called an augmented matrix where each member of the array is called an element or entry. • The rows of an augmented matrix can be treated just like the equations of a linear system.
Concept:Augmented Matrices • Are used to solve systems of linear equations: • Arrange equations in simplified standard form • Put all coefficients into a 2x3 or 3x4 augmented matrix
Reduced Row Echelon Method with the Graphing Calculator Example Solve the system. Solution The augmented matrix of the system is shown below.