Download
1 / 31
310 likes | 402 Vues
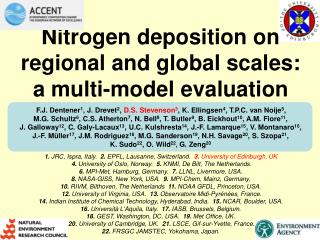
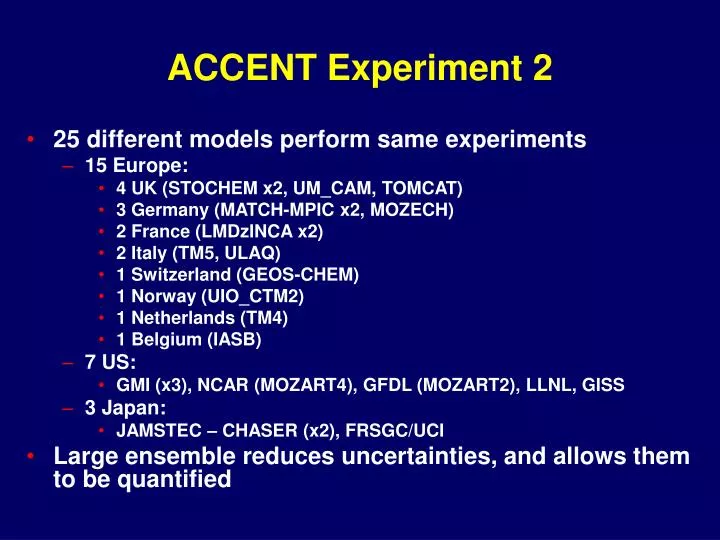
ACCENT Experiment 2. 25 different models perform same experiments 15 Europe: 4 UK (STOCHEM x2, UM_CAM, TOMCAT) 3 Germany (MATCH-MPIC x2, MOZECH) 2 France (LMDzINCA x2) 2 Italy (TM5, ULAQ) 1 Switzerland (GEOS-CHEM) 1 Norway (UIO_CTM2) 1 Netherlands (TM4) 1 Belgium (IASB) 7 US:

E N D
ACCENT Experiment 2 • 25 different models perform same experiments • 15 Europe: • 4 UK (STOCHEM x2, UM_CAM, TOMCAT) • 3 Germany (MATCH-MPIC x2, MOZECH) • 2 France (LMDzINCA x2) • 2 Italy (TM5, ULAQ) • 1 Switzerland (GEOS-CHEM) • 1 Norway (UIO_CTM2) • 1 Netherlands (TM4) • 1 Belgium (IASB) • 7 US: • GMI (x3), NCAR (MOZART4), GFDL (MOZART2), LLNL, GISS • 3 Japan: • JAMSTEC – CHASER (x2), FRSGC/UCI • Large ensemble reduces uncertainties, and allows them to be quantified
ACCENT Expt 2 • Consider 2030 – ‘the next generation’ – of direct interest for policymakers • 3 Emissions scenarios • ‘Likely’: IIASA CLE (‘Current Legislation’) • ‘Low’: IIASA MFR (‘Maximum technically Feasible Reductions’) • ‘High’: IPCC SRES A2 • Also assess climate feedbacks • expected surface warming of ~0.7K by 2030 • Target IPCC-AR4
Climate change/deposition CO People & Organisation • Co-ordination; N+S-deposition, Tropospheric O3 • F. Dentener, D. Stevenson • Surface O3 - impacts on health/vegetation; web-site • K. Ellingsen • NO2 columns – comparison of models and satellite data • T. van Noije, H. Eskes • Emissions • M. Amann, J. Cofala, L. Bouwman, B. Eickhout • Data handling and storage (SRB; ~1 TB of model output) • J. Sundet • Other modellers and contributors: • C.S. Atherton, N. Bell, D.J. Bergmann, I. Bey, T. Butler, W.J. Collins, R.G. Derwent, R.M. Doherty, J. Drevet, A. Fiore, M. Gauss, D. Hauglustaine, L. Horowitz, I. Isaksen, M. Krol, J.-F. Lamarque, M. Lawrence, V. Montanaro, J.-F. Müller, G. Pitari, M.J. Prather, J. Pyle, S. Rast, J. Rodriguez, M. Sanderson, N. Savage, M. Schultz, D. Shindell, S. Strahan, K. Sudo, S. Szopa, O. Wild, G. Zeng
IPCC-AR4-ACCENT ‘High’ Ship Emission Scenario • Scenario S4: IPCC A2, but with ship emissions of the year 2000 • Scenario S4s: "Worst" case ship emission scenario in conjunction with S4.
SO2 High ship emissions: A2s "2030" NOx High ship emissions: A2s "2030" SO2 emissions: A2 "2000" NOx emissions: A2 "2000"
IPCC-AR4-ACCENT ‘High’ Ship Emission Scenario Characteristics: • The idea of comparing A2 to A2s: • What is the influence of ship emissions on tropospheric chemistry in 2030 if they were unabated? • Does an ensemble of models give approximately the same answer regarding the influence of ship emissions? • Status: Data analysis recently started • Thanks to everybody who sent data so far (FRSGC_UCI, LMDz/INCA, MATCH-MPIC, TM4) • We invite all other model groups to join in the inter-comparison • If you are interested, please contact Veronika.Eyring@dlr.de and Axel.Lauer@dlr.de
Year 2000 Anthropogenic NOx Emissions EDGAR database: Jos Olivier et al., RIVM Plot: Martin Schultz, MPI
Year 2000 tropospheric NO2 columns Observed (GOME)(mean of 3 methods) Model(ensemble mean) (10:30am local sampling in both cases) Courtesy Twan van Noije, Henke Eskes – figure from Dentener et al, submitted
Modelled column NO2 vs GOME retrievals over Europe Courtesy Twan van Noije
NOy wet deposition zoom over Europe Courtesy Frank Dentener
Global NOx emission scenarios SRES A2 CLE MFR Figure 1. Projected development of IIASA anthropogenic NOx emissions by SRES world region (Tg NO2 yr-1).
1990 2000 2030 CLE 2030 MFR Regional NOx emissions Ships/aircraft: unregulated; may become larger than any regional source by 2030 USA: ~flat Europe: falling Asia: rising Figure 4. Regional emissions separated for sources categories in 1990, 2000, 2030-CLE and 2030-MFR for NOx [Tg NO2 yr-1]
Emission Changes 2030 CLE - 2000 Plots: Martin Schultz, MPI IIASA RAINS model: Markus Amann et al.
Year 2000 Ensemble meanof 25 models AnnualZonalMean Annual TroposphericColumn
% Standard Deviationof 25 models Absolute Standard Deviationof 25 models Ensemble meanof 25 models Year 2000 Annual Mean O3
Comparison of ensemble mean model with O3 sonde measurements UT250 hPa Model ±1SD Observed ±1SD J F M A M J J A S O N D MT 500 hPa LT 750 hPa 30°S-Eq 30°N-Eq 90-30°N 90-30°S
+10 ppbv +5 ppbv -5 ppbv 2030 A2 - 2000 2030 MRF - 2000 2030 CLE - 2000
Radiative forcing implications Forcings (mW m-2) 2000-2030 for the 3 scenarios: +37% -23% CO2 CH4 O3
Positive stratosphericinflux feedback Negative watervapour feedback Impact of Climate Change on Ozone by 2030(ensemble of 9 models) Mean + 1SD Mean - 1SD Mean Positive and negative feedbacks – no clear consensus
Higher H2O Higher LNOx ? Lower H2O Lower LNOx ? Highest H2O +High Lightning NOx (8 TgN/yr) O3 chemical loss / Tg-O3 yr-1 More complicated- other factors CH4 lifetime / years
Tropospheric water vapour in 6 GCMs Differences of ± 10% in tropics Tropospheric H2O column / g(H2O) m-2 90S Eq 90N
AOT40, May-June-July, mean model, ppb*hours 3000 ppb.h !!! Courtesy Kjerstin Ellingsen
Conclusions • Logistics: • Large group participation – partly due to IPCC-AR4 • Lot of work involved – relies on funding ‘goodwill’ • Need well defined experiments and diagnostics • Central database and strict data format • Assume mistakes will be made in first attempts • Enforce deadlines if possible • Science: • Multi-model ensemble allows uncertainties to be assessed • Sample large model parameter space • Get hints about the controls on internal model processes • Future work: • Water vapour, convection, lightning NOx, isoprene schemes • STE, biomass burning • Global HOx/NOx/NOy budgets, as well as O3 and CH4