Download
1 / 33

E N D
MAP WORK Gayaza High School Geography Department
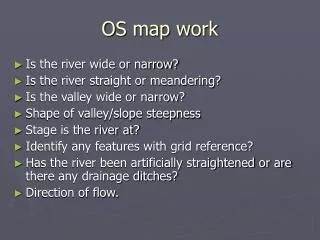
Introduction Map work involves map reading and map interpretation. The kind of maps used are known as survey topographical maps. These maps indicate both the physical and human features in an area. A survey maps has a title, a key, a compass direction, frame and a scale. A number of colours and symbols are used to show different features on the map extract.
Identifying a map In order to identify a map, each map carries a title to indicate the name of the region, country and part of the country it represents. Survey maps carry an index diagram showing the reference numbers according to map-indexing system of the country. For example: East Africa 1:50,000 (UGANDA) KAKUTOSheet 87/4, Series Y732, Edition 3-U.S.D.
SCALE This is the relationship between the map distance and the ground distance. It is the representation of the ground distance on a map. Map scale is always shown in every map and it is commonly expressed in three different ways.
Types of Scale 1. Scale statement. This states the map distance and the ground distance it represents for example 2 centimeters (cm) on the Map represents 1 kilometre (km) on the ground or 2 centimetres (cm) to one kilometre (km)).
2. Arithmetically Expressed scale a)Ratio scale This is the ratio of the map distance to the ground distance. It is important to note that both distances must be in the same units for example 1:50,000 this implies that 1 unit on the map represents 50,000 units on the ground.
b)Representative Fraction scale (RF). This is the map distance expressed as a fraction of the ground distance for example 1/50,000. This implies that the distance on the map is 1/50,000 the distance on the ground.
3. Linear scale/ scale bar It is also known as the scale bar. It takes the form of the bar or a line which is marked off into the several divisions or segments and each segment or division representing a certain ground distance indicated against it. Each of the two divisions to the right of 0 measures 2 cm on the scale and represents 1 km on the ground. On the left of 0 there is one 2-cm division, also representing 1 km on the ground. This division is sub-divided into ten smaller parts each represents one-tenth of a kilometre, which is 100m on the ground.
Conventional symbols A number of conventional symbols and colours are used on a survey map. The meanings of these symbols are indicated on the key or legend just below the map. Draw the symbols used to indicate the following: • All weather loose surface road • Dry weather dry road • Railway line • Main tracks(Motorable)
Bound airfield runway • Grass airfield runway • Telephone lines • Power transmission line • Antiquity • Mineral works • Mosque • Church • County/Municipality boundary
National park, Game Reserve • Secondary Trigonometrical station • Air Photo Principal Point • Culvert • Bridge • Bore hole • Waterfall • Well • Spring
Dam • Pond • Crater • Out crop rock • Cliff • Quarry • Sand or mud • Forest • Scrub • Permanent papyrus swamp • Woodland
Abbreviations • Names, especially abbreviated ones, which cannot be written in full because of limited space, serve as map symbols. Note down the abbreviations for thefollowing:
Church • County Headquarters • Local Government Headquarters • Forest Reserve • Hospital • Market • Ministry of Works
Trading Centre • School • Rest House • Police Station • Dispensary • Post Office
THE GRID SYSTEM This involves the use of gridlines to locate features on a survey map. Gridlines are numbered vertical and horizontal lines on a map. These gridlines are the Eastings and Northings. • Eastings – these are vertical gridlines. They are called so because their values increase towards the East (Eastwards).
Northings – these are horizontal gridlines. They are called so because their values increase towards the North (Northwards). It is important to note that the Eastings values are written against the vertical lines and the Northings values are written against horizontal lines.
Map grid reference This refers to the co-ordinates of the Eastings (vertical lines) and the Northings (horizontal lines) in which the features lies. It refers to the co-ordinates of the point of intersection between the Eastings and the Northings.
It involves writing the value of the Easting first and then adding on the value of the Northing for example if the feature lies on the Easting 09 and on Northing 79 then its grid reference would be 090790. It is important to note that grid references have six figures.
It Six-figure grid references give the position of any place on a map with very reasonable accuracy. A four-figure reference simply indicates the square within which the place referred to is found.
Measurement of the ground distance on a map The ground distance is determined on a map by the help of the scale and more especially the linear scale. This is done by obtaining the map distance using a thread or a piece of paper and transferring it onto the linear scale just below the map to determine the distance in kilometres.
The measurement of the distance can be along straight lines or along winding/meandering features like a road, railway line and river.
Determination of the direction on a map Direction may be in form of compass direction or compass bearing. The compass direction involves four cardinal points namely North, East, South and West. There are also twelve (12) other sub-cardinal points for example north east, south east, north west and south west etc.
Declination diagram There are three (3) slightly different directions called North on a survey map. They are indicated by a special symbol like figure known as a declination diagram showing the positions and angles of the Grid North and Magnetic North in relation to the True North
TRUE NORTH: this is the direction of the North Pole from the observer. It is the line from any position on the earth’s surface to the North Pole. All lines of longitude are true North lines.
MAGNETIC NORTH: this is the direction to which a magnetic compass needle points. This is the direction of the magnetic North Pole from any position on the earth’s surface. • GRID NORTH: this is the direction of the Eastings (the vertical or north –South grid lines) on a survey map.
Compass Bearing Bearing on a map is the angle measured from grid North in a clock wise direction that is towards the right. Bearings are usually stated in three (3) figures/digits for example if the angle measured is 350 then the bearing would be stated as 0350
All cardinal and sub-cardinal points have their own bearings for example east is 0900, south is 1800, west is 2700 etc. The values of the bearings range from 0000 to 3600. For example if we are asked to measure the bearing of C from S the following steps should be taken;
PROCEDURE • Draw a light line to join the two points that is join X to Z with a thin line. • Draw a vertical line through X that is pointing to North –being parallel to the Eastings and perpendicular to the northings. • Use the protractor, measure the angle at X from the north in a clock wise direction or measure the angle in the anti-clock wise direction and subtract if from 3600.
CALCULATION OF THE AREA Ground area for irregular shapes can be calculated on a map using grid squares. Grid squares can be used to as ground area units. It is important to note that the side of grid square is two (2) cm which represents 1km on the ground. Therefore, the area covered by a grid square on a map is (1×1) = 1 km2.
Calculation of the ground area, therefore, involves the counting of full/complete grid squares and incomplete squares/less than full grid squares. The less than full squares are averaged as “Half squares” Therefore, Area = Full Squares + Half Squares 2
Exercise Study the 1:50,000 (UGANDA) map extract of ABOKE and answer the following questions. 1. State the bearing of the road junction at Ayer Trading centre from the Air photo principal point at grid reference 624566. 2. Calculate the area of Icheme Sub County in the area shown on the map.
3. Measure and state in Kilometres. the ground distance of the all weather loose surface road from grid reference 530508 to the road junction at grid reference 627565 4. With evidence from the map extract, identify the economic activities carried in the area.