Download
1 / 30
320 likes | 478 Vues
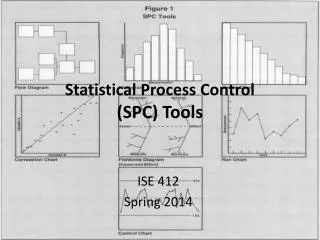
Chapter 6 Statistical Process Control (SPC). Descriptive Statistics. 1. Measures of Central Tendencies (Location) Mean Median = The middle value Mode - The most frequent number 2. Measures of Dispersion (Spread) Range R=Maximum-Minimum Standard Deviation Variance . x. x. x.

E N D
Chapter 6 Statistical Process Control (SPC)
Descriptive Statistics 1.Measures of Central Tendencies (Location) • Mean • Median = The middle value • Mode - The most frequent number 2. Measures of Dispersion (Spread) • Range R=Maximum-Minimum • Standard Deviation • Variance
x x x x x 1 2 3 4 5 6 7 8 µ The Standard Deviation (x-µ)
68.26% 95.46% 99.73% The Normal (Gaussian) Curve -3-2-1+1+2+3
Types of Control Charts Quality Characteristic Attribute Variable Type of Attribute X and MR chart No n>1 Defective Defect Yes Constant sample size? Constant sampling unit? Yes Yes No X-bar and R chart n>6 Yes No np-chart No c-chart X-bar and s chart p-chart u-chart
Data Stats • Information • Central Tendency • Dispersion • Shape No Action Decision Action
median median mode mode mean mean Skewed to the right (positively skewed) Skewed to the left (negatively skewed) The Shape of the Data Distribution • “Box-and-Whisker” Plot mean = median = mode • Pearsonian Coefficient of Skewness
Special Cause (Assignable) Control Charts Special Cause (Assignable) +3σ Average -3σ Common Cause (Chance or Random)
Standard Error of the Mean Central Limit Theorem Sample (x-bar) Distribution Population (individual) Distribution μ
X-Bar and R Example Rational Subgroup Subgroup Interval
p-Chart Example *Note: Use n-bar if all n’s are within 20% of n-bar
β β β The α and β on Control Charts α = .00135 +3σ Average -3σ α = .00135
3 2 1 Average -1 -2 Out of Control Patterns 8 successive points same side of centerline 2 of 3 successive points outside 2 -3 4 of 5 successive points outside 1
Control Chart Patterns Instability “Freaks” Gradual Trend Sudden Shifts Cycles “Hugging” Centerline “Hugging Control Limits”
Six Sigma Process Capability 1.5 Cp = 2.0 .54 ppm Cpk = 1.5 3.4 ppm LSL USL
Cause and Effect Diagrama.k.a. Ishikawa Diagram, Fishbone Diagram Person Procedures A B C Process Material Equipment
Vital Few Trivial (Useful) Many Pareto Charta.k.a. 80/20 Rule
The Taguchi Loss Function: L (x) = k (x-T)2 Loss ($) .480 .500 .520 Traditional Loss Function: Loss ($) .480 .500 .520 Taguchi Loss Function
Most “Robust” Setting Response Curves