Download
1 / 54
560 likes | 758 Vues
Air and Air Pollution. The Atmosphere. Stratosphere 11-30 miles Little water vapor Ozone layer UV filter Troposphere 11 mile at equator; 8 miles at poles weather breeder 78% N, 21% O Natural heating Solar radiation Greenhouse effect. The Atmosphere. Exosphere Thermosphere

E N D
The Atmosphere • Stratosphere • 11-30 miles • Little water vapor • Ozone layer • UV filter • Troposphere • 11 mile at equator; 8 miles at poles • weather breeder • 78% N, 21% O • Natural heating • Solar radiation • Greenhouse effect
The Atmosphere • Exosphere • Thermosphere • ionosphere • aurorea borialis • hottest layer • 1000 C • Mesosphere • very little atmosphere • coldest layer
Atmospheric pressure (millibars) Temperature Pressure Mesopause Stratopause Tropopause 0 200 400 600 800 1,000 120 75 110 65 Thermosphere 100 90 55 80 45 70 Mesosphere 60 Altitude (miles) Altitude (kilometers) 35 50 Heating via ozone 40 25 Stratosphere 30 15 Ozone “layer” 20 Heating from the earth Troposphere 10 5 Pressure = 1,000 millibars at ground level 0 –80 –40 0 40 80 120 (Sea Level) Temperature (˚C)
Photochemical ozone 40 25 35 20 Stratosphere 30 Benefical Ozone 25 Stratospheric ozone 15 Altitude (kilometers) Altitude (miles) 20 10 15 10 5 Troposphere Harmful Ozone 5 0 0 0 5 10 15 20 Ozone concentration (ppm)
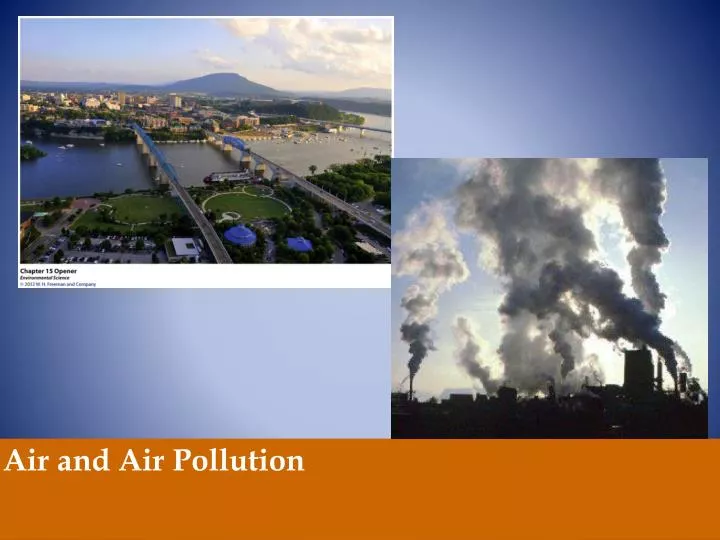
Air Pollution • introduction of chemicals, particulate matter, or microorganisms into the atmosphere at concentrations high enough to harm plants, animals, and materials such as buildings, or to alter ecosystems. • the presence of one or more chemicals in the atmosphere in sufficient quantities and duration to (1) cause harm to us, other forms of life, and materials, or (2) alter climate.
Carbon oxides Carbon monoxide and carbon dioxide Sulfur oxides Sulfur dioxide and sulfur trioxide Nitrogen Oxides Nitric oxide, nitrogen dioxide, nitrous oxide Volatile Organic Compounds Methane, propane, CFCs Photochemical Oxidants Ozone, peroxyacal nitrates (PAN), hydrogen peroxide (H2O2) Suspended particulate matter (SPM) Dust, soot, asbestos, lead, nitrate, and sulfate salts Sulfuric acid, PCBs, dioxins, pesticides Radioactive substances Radon-222, iodine-131, strontium-90, plutonium-239 Hazardous Air Pollutants (HAPS) Major Classes of Air Pollutants
Criteria Air Pollutants Identified by the Clean Air Act 1970 EPA uses six "criteria pollutants" as indicators of air quality • Nitrogen Dioxide: NO2 • Ozone: ground level O3 • Carbon monoxide: CO • Lead: Pb • Particulate Matter: PM10 (PM 2.5) • Sulfur Dioxide: SO2 • Volatile Organic Compounds: (VOCs) EPA established for each concentrations above which adverse effects on health may occur
Clean Air Act http://www.epa.gov/air/oaq_caa.html • Title I - Air Pollution Prevention and Control • Part A - Air Quality and Emission Limitations • Part B - Ozone Protection (replaced by Title VI) • Part C - Prevention of Significant Deterioration of Air Quality • Part D - Plan Requirements for Nonattainment Areas • Title II - Emission Standards for Moving Sources • Part A - Motor Vehicle Emission and Fuel Standards • Part B - Aircraft Emission Standards • Part C - Clean Fuel Vehicles • Title III - General • Title IV - Acid Deposition Control • Title V - Permits • Title VI - Stratospheric Ozone Protection
Nitrogen Dioxide (NO2) • Properties: reddish brown gas, formed as fuel burnt in car, strong oxidizing agent, forms Nitric acid in air • Effects: acid rain, lung and heart problems, decreased visibility (yellow haze), suppresses plant growth • Sources: fossil fuels combustion, power plants, forest fires, volcanoes, bacteria in soil • Class: Nitrogen oxides (NOx) • EPAStandard: 0.053 ppm
Tropospheric Ozone (O3) • Properties: colorless, unpleasant odor, major part of photochemical smog • Effects: lung irritant, damages plants, rubber, fabric, eyes, • Sources: Created by sunlight acting on NOx and VOC , photocopiers, cars, industry, gas vapors, chemical solvents, incomplete fuel combustion products • Class: photochemical oxidants
Ozone (O3) • 10,000 to 15,000 people in US admitted to hospitals each year due to ozone-related illness • Children more susceptible • Airways narrower • More time spent outdoors
Carbon Monoxide (CO) • Properties:colorless, odorless, heavier than air, 0.0036% of atmosphere • Effects:binds tighter to Hb than O2, mental functions and vision, even at low levels • Sources:incomplete combustion of fossil fuels 60 - 95% from auto exhaust • Class:carbon oxides (CO2, CO) • EPAStandard:9 ppm • 5.5 billion tons enter atmosphere/year
Lead (Pb) • Properties: grayish metal • Effects: accumulates in tissue; affects kidneys, liver and nervous system (children most susceptible); mental incapacitation; possible carcinogen • Sources: particulates, smelters, batteries • Class:toxic or heavy metals • EPAStandard: 1.5 ug/m3 • 2 million tons enter atmosphere/year
Suspended Particulate Matter (PM10) • Properties: particles suspended in air (<10 um) • Effects: lung damage, mutagenic, carcinogenic, teratogenic • Sources:burning coal or diesel, volcanoes, factories, unpaved roads, plowing, lint, pollen, spores, burning fields • Class: SPM: dust, soot, asbestos, lead, PCBs, dioxins, pesticides • EPA Standard: 50 ug/m3 (annual mean)
Sulfur Dioxide (SO2) • Properties: colorless gas with irritating odor • Effects: produces acid rain (H2SO4), breathing difficulties, eutrophication due to sulfate formation, lichen and moss are indicators • Sources:burning high sulfur coal or oil, smelting or metals, paper manufacture • Class: sulfur oxides • EPA Standard: 0.3 ppm (annual mean) • Combines with water and NH4 to increase soil fertility
VOCs (Volatile Organic Compounds) • Properties: organic compounds (hydrocarbons) that evaporate easily, usually aromatic • Effects: eye and respiratory irritants; carcinogenic; liver, CNS, or kidney damage; damages plants; lowered visibility due to brown haze; global warming • Sources:vehicles(largest source),evaporation of solvents or fossil fuels, aerosols, paint thinners, dry cleaning • Class: HAPs (Hazardous Air Pollutants) • Methane • Benzene • Chlorofluorocarbons (CFCs), etc. • Concentrations indoors up to 1000x outdoors • 600 million tons of CFCs
Types of Pollutants • Primary pollutants- polluting compounds that come directly out of the smoke-stack, exhaust pipe, or natural emission source. • Examples: CO, CO2, SO2, NOx, and most suspended particulate matter. • Secondary Pollutants - pollutants that have undergone transformation in the presence of sunlight, water, oxygen, or other compounds. • Examples: ozone, sulfate and nitrate
Photochemical Reaction • Photochemical Smog • a mixture of primary and secondary pollutants formed under the influence of sunlight • Brown Air Smog • (N2 + O2 --->2NO) high temps • (2NO + O2---> 2NO2) • NO2 (yellowish brown gas) • any chemical reaction activated by light
Industrial Smog Fig. 17-8 p. 426 • Gray Smog • Comes from burning coal • Sulfur Dioxide • Sulfuric Acid • Particulates • Unburned Carbon
Thermal Inversions • Thermal Inversion- when a relatively warm layer of air at mid-altitude covers a layer of cold, dense air below. • The warm inversion layer traps emissions that then accumulate beneath it.
Fig. 17-9 p. 427 Temperature Inversions • Subsidence inversion
Descending warm air mass Inversion layer Sea breeze Increasing altitude Mountain range Decreasing temperature Temperature Inversions • Radiationinversion
Acid Deposition • Acid deposition- occurs when nitrogen oxides and sulfur oxides are released into the atmosphere and combine with atmospheric oxygen and water. These form the secondary pollutants nitric acid and sulfuric acid. • Secondary pollutants further break down into nitrate and sulfate which cause the acid in acid deposition.
Effects of Acid Deposition • Lowering the pH of lake water • Decreasing species diversity of aquatic organisms • Mobilizing metals that are found in soils and releasing these into surface waters • Damaging statues, monuments, and buildings
Ways to Prevent Air Pollution • Removing sulfur dioxide from coal by fluidized bed combustion • Catalytic converters on cars • Scrubbers on smoke stacks • Baghouse filters • Electrostatic precipitators
Stratospheric Ozone • The stratospheric ozone layer exists roughly 45-60 kilometers above the Earth. • Ozone has the ability to absorb ultraviolet radiation and protect life on Earth.
Formation and Breakdown of Ozone • First, UV-C radiation breaks the bonds holding together the oxygen molecule )2, leaving two free oxygen atoms: O2 + UV-C -> 2O • Sometimes the free oxygen atoms result in ozone: O2 + O -> O3 • Ozone is broken down into O2 and free oxygen atoms when it absorbs both UV-C and UV-B ultraviolet light: O3 + UV-B or UV-C -> O2 + O
Depletion of the Ozone Layer • Global Ozone concentrations had decreased by more than 10%. • Depletion was greatest at the poles • Decreased stratospheric ozone has increased the amount of UV-B radiation that reaches the surface of Earth. • Montreal Protocol- international agreement to reduce CFC’s.
Fig. 17-17 p. 434 Indoor Air PollutionSick Building Syndrome
Sick Building Syndrome • A persistent set of symptoms in > 20% population • Causes(s) not known or recognizable • Complaints/Symptoms relieved after exiting building
Headaches Fatigue Reduced Mentation Irritability Eye, nose or throat irritation Dry Skin Nasal Congestion Difficulty Breathing Nose Bleeds Nausea Complaints/Symptoms
Building Related Illness • Clinically Recognized Disease • Exposure to indoor air pollutants • Recognizable Causes
Clinically Recognized Diseases • Pontiac Fever – Legionella spp. • Legionnaire's Disease • Hypersensitivity Pneumonitis • Humidifier Fever • Asthma • Allergy • Respiratory Disease • Chronic Obstructive Pulmonary Disease
Sources of Indoor Air Pollutants • Building materials • Furniture • Furnishings and fabrics • Glues • Cleaning products • Other consumer products • Combustion appliances (cookers and heaters) • Open fires • Tobacco smoking • Cooking • House dust mites, bacteria and moulds • Outdoor air
Important Indoor Air pollutants • Nitrogen dioxide • Carbon monoxide • Formaldehyde • Volatile Organic Compounds (VOCs) • House dust mites (and other allergens, e.g. from pets) • Environmental tobacco smoke • Fine particles • Chlorinated organic compounds (e.g. pesticides) • Asbestos and man-made mineral fibres • Radon
Most dangerous indoor pollutants • Cigarette smoke • Formaldehyde • Radon-222 gas
Radon Fig. 17-18 p. 436 • Radon-222 • Associated with uranium (U-238) and organic material in rocks • 2nd leading cause of lung cancer • 4 picocuries • EPA proposed standard
Effects of Air Pollution on Living Organisms and Materials • Damage to mucous membranes • Respiratory diseases • Lung cancer • Asthma – allergic reaction • Chronic bronchitis – persistent inflammation • Emphysema – irreversible damage