Download
1 / 13
150 likes | 390 Vues
Global Distribution and Transport of Air Pollution. Presented at The Haagen-Smit Symposium: From Los Angeles to Global Air Pollution Lake Arrowhead, April 9-12, 2001 Rudolf Husar CAPITA, Washington University , St. Louis. Background. Global-scale air pollution existed since…..

E N D
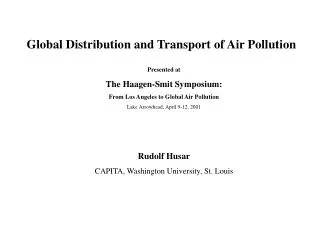
Global Distribution and Transport of Air Pollution Presented at The Haagen-Smit Symposium: From Los Angeles to Global Air Pollution Lake Arrowhead, April 9-12, 2001 Rudolf Husar CAPITA, Washington University, St. Louis
Background • Global-scale air pollution existed since….. • The difference is that now we can observe it! • Outline of Presentation • Major pollutant sources and emissions • Observation-based global chemical climatology of major gases and aerosols • Illustration of global-scale dust and smoke events • Opportunities and challenges of the the 21st century
Industrial Sulfur Emission Density Regional hot-spots for industrial sulfur emissions Eastern North America, Europe East Asia The regional hot-spots for industrial sulfur emissions are in E. North America, Europe and E. Asia • Long Term Trends • North America: roughly constant for the past century • Europe:Rise after WW II but leveled off since 1990 • East Asia: Sharp rise since the 1960s.
Continental Surface Visibility (Human Observers) NOAA NCDC Global Summary of the Day (SOD) 7000 Observations Low Visibility High Visibility
Extinction coefficient (visibility) for SE Asia Dec, Jan, Feb Sep, Oct, Nov The most intense and persistent regional haze is over India During 1997 biomass fires in Indonesia caused unusually intense haze
Extinction coefficient (visibility) for N. America Dec, Jan, Feb Jun, Jul, Aug The haze over N. America is modest compared to hazy regions of Africa, E. Asia and S. America
Haze over ChinaSeaWiFS • Industrial haze covers most of Eastern China • Haze is confined to low-lying areas and valleys
The Asian Dust Event of April 1998 Mongolia China Korea On April 19, 1998 a major dust storm occurred over the Gobi Desert The dust cloud was seen through SeaWiFS, TOMS, GMS, AVHRR satellites The dust transport was followed on-line by an an ad-hoc international group
SeaWiFS/TOMS data for April 21 shows dust transport to the Pacific Japan
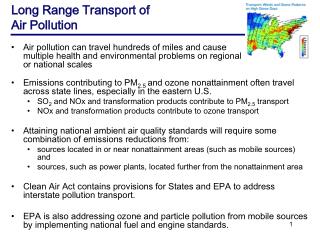
Trans-Pacific Dust Transport The dust cloud traversed the Pacific in 6 days at about 4 km altitude As the dust approached N. America, it subsided to the ground
Reg. Avg. PM10 Asian Dust Cloud over N. America 100 mg/m3 Hourly PM10 On April 27, the dust cloud rolled into North America. The regional average PM10 increased to 65 mg/m3 In Washington State, PM10 exceeded 100 mg/m3
Fine Particle Dust Concentrations (IMPROVE) April 25, 1998 April 29, 1998 May 2, 1998 On April 25, the western U.S. was virtually dust-free. Highest concentration was an April 29. On May 2, the high levels moved (?) to the Colorado Plateau.
Summary of Global Air Pollution and Transport • The global sulfur emissions have shifted from N. America and Europe to East Asia. • The industrial ‘belt’, 30-60 deg N, is dominated by anthropogenic SOx, NOx and O3. This conforms to the conventional wisdom since the 1970s. • Recent satellite data show that NOx, HC and aerosols are dominated by biomass burning in the subtropics and the southern hemisphere. ?? • The radiatively active global aerosol is dominated by smoke and dust, rather then by industrial sulfates as we have presumed. • Episodic trans-continental transport of dust and smoke (ozone?) can now be detected and modeled routinely. • Such extra-jurisdictional ‘pollution’ events cause significant episodic impact on the air quality of N. America.