Download

1 / 22
220 likes | 227 Vues
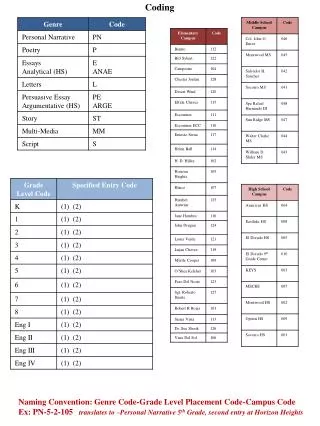
QuIP Coding. 1. Key features of QuIP coding. Systematic coding of impact evidence as explicit, implicit or incidental to project actions. Flexible thematic coding of positive and negative outcomes (changes) and drivers of change.

E N D
Key features of QuIP coding • Systematic coding of impact evidence as explicit, implicit or incidental to project actions. • Flexible thematic coding of positive and negative outcomes (changes) and drivers of change. • Coding is both inductive and deductive as well as exploratory and confirmatory. • Coding process is transparent: all coding captured in the annotated transcript. • Demystifies the ‘black box’ of qualitative analysis process. 2
A word on words • QuIP coding: the process of systematically working through interview data and identifying statements of change which are then coded according to driver of change and outcome tags, building up the causal chain. • Tags: the description of the coding shorthand being used to describe the driver of change or outcome. • Tagging key: the list of all of the drivers of change and outcome tags being used. 3
Essential information for QuIP analyst The data analyst must not be blindfolded and should have as much information regarding the intervention as possible, e.g. • Theory of change of the programme/intervention – this is vital • Programme documentation; proposals, sample selection, known interventions with local delivery details and dates (particularly for the communities sampled for the QuIP) etc. • Any known issues which came up during the project (internal or external) • Monitoring data (particularly for the communities sampled for the QuIP) 4
QuIP triple coding The QuIP uses a process of ‘triple coding’: • Driver of changecodes to describe what led to change, positive or negative. • Outcome codes to describe the change/s which occurred, positive or negative. • Attribution codes assessing whether change is positive or negative, and strength of relationship to project being assessed. The analyst can then interrogate: • Overall trends and strength of project-related attribution • Relationships between drivers and outcomes 5
QuIP coding • Some coding tags are likely to change as you go through the data, and you may find yourself returning to previous entries to amend them – either breaking them down further or amalgamating tags. • This is not an exact science, it is a process of engagement with and interpretation of the data, and different people may interpret tags and even codes in subtly different ways. However, in an effort to ensure some consistency there are a few key principles which you should bear in mind as you code. 6
QuIP coding • We are looking for stories of change. Where there is no change, the data should not be coded at all. If the responses appear very interesting and you feel the commissioner should see it, you can code with a ‘9’ to ensure that it is captured in the narrative appendix. If it is not coded it will not appear in the narrative data at all. • Answers can and should be broken down into different sections in order to allow for coding and tagging in different ways. This is important to track the relationship between different drivers and outcomes 7
Driver of change codes • Use alphanumerical codes as shorthand: D1-D100 • The driver descriptions are unique to each project • Selecting a driver of change may entail going back a few ‘causal steps’, and reading the respondent’s story as a whole. • Sometimes the root cause of a trigger is only mentioned once, but the effects referred to throughout the data: use the same attribution tag every time a resulting impact is reported. • Drivers of change can be thematically clustered once coding has been completed. 8
Example driver of change codes • The alphanumerical code is simply shorthand for the driver of change, e.g. • D1: Unexpected rainfall (which leads to low crop yields which could then continue to be the reason for a number of other outcomes; pulling children out of education, poor diet, sale of assets etc.) • D2: Training in irrigation (which increased crop yields which could then be the reason for increased income which could then become a driver as well as an outcome - leading to many other positive outcomes) 9
Outcome codes • Alphanumerical outcome codes capture reported change, positive or negative: OP1-OP50/ ON1-ON50 • Outcomes can be primary, secondary or tertiary • The related drivers and outcomes should be entered on the same row in the spreadsheet. You are telling a story of change through the codes… Driver of change (D#) Relationship to the intervention (1-9) Outcome(s) (OP#/ON#) 11
Outcome codes • Note that drivers can also be outcomes, since many stories of change involve multiple steps, creating a causal chain. For example: • Agricultural Training (D1) led to Improved Yields (OP1) • Improved Yields (OP1) led to Increased Income (OP2) • Increased Income (OP2) led to Improved nutrition & health (OP3) • It is possible to query the relationships between these drivers and outcomes to establish the number of times they occur as a causal chain across the data set 12
Building the causal chains By linking the drivers of change to the outcomes, the analyst builds up causal chains, telling the stories of change. 13
Attribution Codes • Attribution codes are numerical (1-9) and are based on how closely the attribution was linked to the known intervention. • Attribution is not always clear and it is important to read the interview as a whole in order to establish to whom or what any changes have been attributed. 15
Attribution Codes These can be used flexibly for your project, but as a guide: • If the commissioner or their agent is mentioned by name it should always be 1 or 2 but sometimes it can be very clear that they are referring to intervention activities even without citing a name. If you are not sure it should be a 3 or 4. • Code 4 can be used when respondents refer to negative drivers which are not a direct result of the project, but affect the outcome. This may include cases where the driver of change is outside the control of the commissioner (e.g. climate), but directly affects the success or failure of the project. This signposts the reader to the drivers which are most relevant to their project, e.g. “The productivity of coffee has been good in the last three years but in the last harvest period the production was bad due to unexpected rainfall.” 17
Focus group discussions Use the same flexible thematic process of QuIP triple coding. Focus groups can be transcribed in two ways: • Summary of responses as a group • Responses broken down by respondent , e.g. R1: We are eating less food now because of the drought R2: Yes, the drought has reduced our food consumption – we are not able to grow enough to feed our families. R3: But it’s much easier to access water now with the new bore hole that NGO X drilled. 21
Summary of QuIP coding process • Read through the complete interview • Find the first story of change • Identify the main change and code it (OP#/ ON#) • Work backwards to find the cause or driver of this change – remember there may be a causal chain (D# - OP#- OP# - OP#) • Identify who/what the respondent attributes this change to (1-9) 22