Download
1 / 14
140 likes | 143 Vues
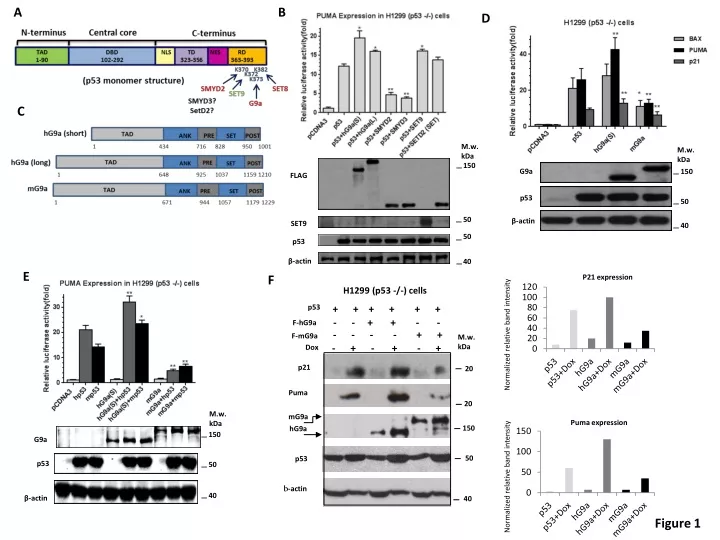
A. B. D. C. M.w. kDa. G9a. 150. FLAG. p53. β-actin. 50. SET9. 50. p53. β -actin. 40. E. F. P21 expression. H1299 (p53 -/-) cells. p53. + + + + + +. - - + + - -. F-hG9a. Normalized relative band intensity. F-mG9a.

E N D
A B D C M.w. kDa G9a 150 FLAG p53 β-actin 50 SET9 50 p53 β-actin 40 E F P21 expression H1299 (p53 -/-) cells p53 + + + + + + - - + + - - F-hG9a Normalized relative band intensity F-mG9a - - - - + + M.w. kDa - + - + - + Dox p21 20 Puma 20 M.w. kDa M.w. kDa mG9a Puma expression 150 hG9a 150 150 G9a 50 p53 50 p53 50 Normalized relative band intensity 40 b-actin 40 β-actin 40 Figure 1
C A M.w. kDa + - pLKO + - - + shG9a - + 150 G9a β-actin 40 shG9a#pool shG9a#2 D mRNA Expression (fold) mRNA Expression (fold) B - - + + - - - - F-hG9a(S) F-hG9a(L) - - - - + + - - F-hGLP - - - - - - + + M.w. kDa - + - + - + - + Dox FLAG 150 p53 50 β-actin 40 Figure 2
A B HCT116 (p53+/+) cells treated with BIX-01294 Fold activation, PUMA-luc M.w. kDa 50 p53 β-actin 40 Figure 3
A B C D H1299 (p53 -/-) cells H1299 (p53 -/-) Cells p21 promoter Start Site IP: α-FLAG M.w. kDa DAPI (DNA) GFP (p53) α-IgG α-FLAG INP p53RE CBP -2250 +1 250 150 merge Flag (G9a) Flag-G9a (S) 50 p53 Relative Fold Change H460 (p53 +/+) cells CBP PUMA promoter Start Site G9a (S) p53RE CBP DAPI (DNA) +1 -224 Flag (G9a) merge p53 E Dual cross-linking ChIP: HCT116 cells (α-CBP) G H F M.w. kDa M.w. kDa CBP 250 CBP 250 150 G9a FLAG-G9a 150 β-actin 40 p53 50 β-actin 40 Figure 4
A B H460 (p53 +/+) cells pCDNA3 hG9a(S) mG9a -Dox +Dox D H1299 (p53 -/-) cells pLKO + - C pLKO-shG9a - + + + M.w. kDa p53 + + Dox 150 G9a PARP 100 Cleaved-PARP p53 50 β-actin 40 Figure 5
GEO dataset ID: GSE13213 GEO dataset Type: lung cancer GEO dataset ID: GSE31210 GEO dataset Type: lung adenocarcinoma I-II stage group=1: low expression of G9A group=2: high expression of G9A N Observed Expected (O-E)^2/E (O-E)^2/V group=1 96 18.4 13.5 1.78 3.34 group=2 127 13.8 18.7 1.28 3.34 Chisq= 3.3 on 1 degrees of freedom, p= 0.0677 A B Survival differences between Group=1 and Group=2 Group=1: green , strong positive correlation (0.79) between TP53 and G9A Group=2: red , no (or negative) correlation (-0.22) between TP53 and G9A N Observed Expected (O-E)^2/E (O-E)^2/V group=1 88 23.9 30.73 1.53 9.51 group=2 28 14.3 7.48 6.26 9.51 Chisq= 9.5 on 1 degrees of freedom, p= 0.00204 Figure 6
Me Me CDP/Cut, Gfi1, UHRF1, WIZ PCAF CBP CBP hG9a mG9a Ac Ac p53 p53 TATA TATA Transcription NO transcription Human G9a Mouse G9a Figure 7
3 + + [H ]-Me M.w. kDa Coomassie GST-p53300-393 + + Histones 6His-G9a 130 100 70 GST-p53300-393 55 35 25 Histones Histones Histones 15 KMT G9a 130 95 72 6His-Set7/9 55 GST-p53300-393 43 34 26 17 KMT Set7/9 130 95 72 Flag-Smyd2 55 GST-p53300-393 43 34 26 17 KMT Smyd2 Supplementary S1
M.w. kDa 150 G9a 50 mp53 β-actin 40 Supplementary S2
M.w. kDa 150 50 40 Flag-G9a p53 β-actin Supplementary S3
Relative Fold Change Supplementary S4
H460 (p53 +/+) cells - + - hG9a(S) M.w. kDa - - + mG9a + + + Dox PARP 100 Cleaved-PARP G9a 150 p53 50 β-actin 40 Supplementary S5
GEO dataset ID: GSE36471 GEO dataset Type: lung cancer Survival differences between Group=1 and Group=2 Group=1: green , strong positive correlation (0.67) between TP53 and G9A Group=2: red , no (or negative) correlation (-0.64) between TP53 and G9A N Observed Expected (O-E)^2/E (O-E)^2/V group=1 28 8.17 10.73 0.611 6.17 group=2 7 4.01 1.45 4.512 6.17 Chisq= 6.2 on 1 degrees of freedom, p= 0.013 Supplementary S6
GEO dataset ID: GSE39582 Cancer Type: Colon cancer p-value: 0.0227 Positive effect: EHMT2__high|TP53__high N Observed Expected (O-E)^2/E (O-E)^2/V EHMT2__high|TP53__high; 67 15.4 23.1 2.58 5.19 Other; 123 45.8 38.1 1.56 5.19 Chisq= 5.2 on 1 degrees of freedom, p= 0.0227 Supplementary S7