Download
1 / 7
100 likes | 430 Vues
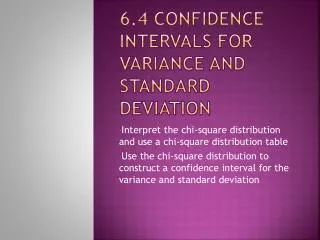
6.4 Confidence Intervals for Variance and Standard Deviation. Key Concepts: Point Estimates for the Population Variance and Standard Deviation Chi-Square Distribution Building and Interpreting Confidence Intervals for the Population Variance and Standard Deviation.

E N D
6.4 Confidence Intervals for Variance and Standard Deviation • Key Concepts: • Point Estimates for the Population Variance and Standard Deviation • Chi-Square Distribution • Building and Interpreting Confidence Intervals for the Population Variance and Standard Deviation
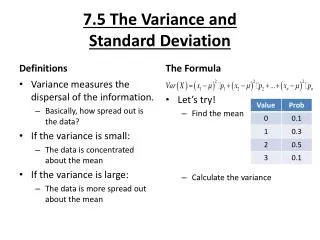
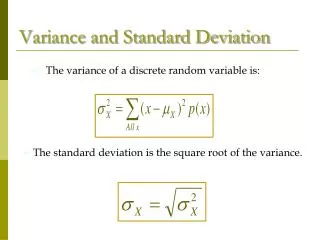
6.4 Confidence Intervals for Variance and Standard Deviation • How do we estimate the population variance or the population standard deviation using sample data? • The variation we see in the sample will be our best guess. • the sample variance, s2, is used to estimate σ2 • the sample standard deviation, s, is used to estimate σ • To build confidence intervals for σ2 and σ, we start with the sampling distribution of a modified version of s2.
6.4 Confidence Intervals for Variance and Standard Deviation • If we find all possible samples of size n from a normal population of size N and then record the value of for each sample, it can be shown that follows a chi-square distribution with n – 1 degrees of freedom.
6.4 Confidence Intervals for Variance and Standard Deviation • Properties of the chi-square distribution: • All chi-square vales are greater than or equal to zero. • The shape of a chi-square curve is determined by the number of degrees of freedom. • The area below a chi-square curve is 1. • All chi-square curves are positively skewed. • Practice working with chi-square curves #4 p. 341 #6
6.4 Confidence Intervals for Variance and Standard Deviation • How do we build confidence intervals using this information? We can start with: and use algebra to get to:
6.4 Confidence Intervals for Variance and Standard Deviation • Fortunately, we can use the previous result for both confidence intervals. • To build a confidence interval for the populationvariance, we use: • To build a confidence interval for the populationstandard deviation, we use:
6.4 Confidence Intervals for Variance and Standard Deviation • Guidelines for constructing these confidence intervals are provided on page 339. • Remember the population must be normal for us to apply these techniques. • When building our confidence intervals, we need the chi-square curve with n – 1 degrees of freedom. • Practice: #10 p. 341 (Cough Syrup) #16 p. 342 (Cordless Drills) #17 p. 342 (Pulse Rates)