Download

1 / 7
70 likes | 244 Vues
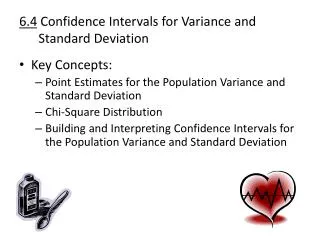
6.4 Confidence intervals for Variance and Standard deviation. Interpret the chi-square distribution and use a chi-square distribution table Use the chi-square distribution to construct a confidence interval for the variance and standard deviation.

E N D
6.4 Confidence intervals for Variance and Standard deviation Interpret the chi-square distribution and use a chi-square distribution table Use the chi-square distribution to construct a confidence interval for the variance and standard deviation
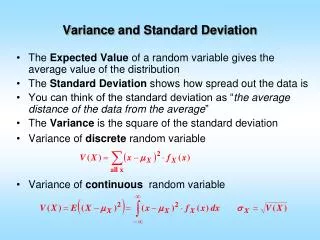
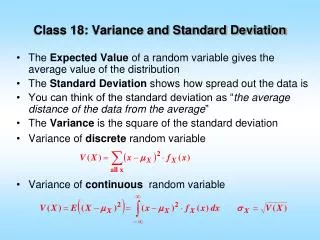
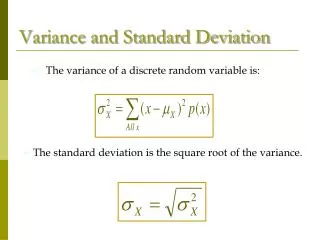
The point estimate for σ² is s² and the point estimate for σ is s. The most unbiased estimate for σ² is s². Point estimates for variance and standard deviation
If a random variable x has a normal distribution, then the distributions of forms a chi-square distribution for samples of any size n > 1. Chi-square distribution
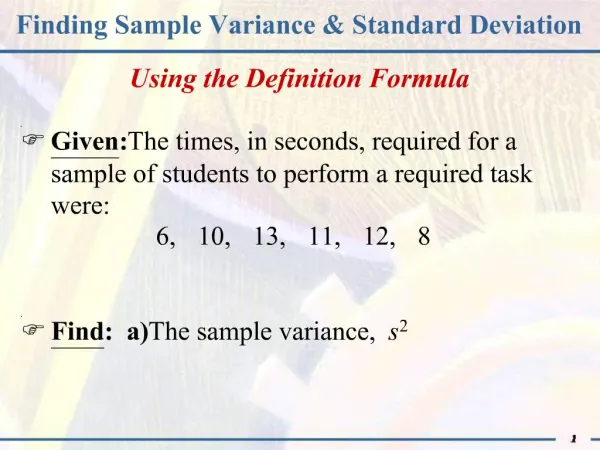
Try it yourself 1 • Finding Critical Values for X² Find the critical values for a 90% confidence interval when the sample size is 30. Critical values: 17.708 and 42.557
The c-confidence intervals for the population variance and standard deviation are as follows. Confidence Interval for σ²: Confidence Interval for σ: The probability that the confidence intervals contain σ² or σ is c. Confidence INTERVALS FOR VARIANCE AND Standard deviation
Try it yourself 2 • Constructing a Confidence Interval You randomly select and weigh 30 samples of an allergy medicine. The sample standard deviation is 1.20 milligrams. Assuming the weights are normally distributed, find the 90% and 95% confidence intervals for the population variance and standard deviation of the medicine weights. 90% CI for σ² (0.98, 2.36) and 90% CI for σ (0.99, 1.54) 95% CI for σ² (0.91, 2.60) and 95% CI for σ (0.96, 1.61)