Download
1 / 15
150 likes | 154 Vues
Explore the different mechanisms that initiate convection during the COPS experiment to improve quantitative precipitation forecasting (QPF).

E N D
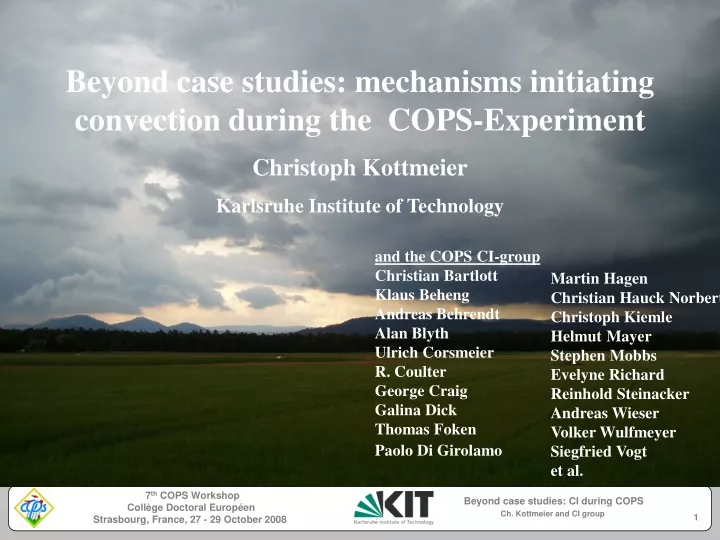
Beyond case studies: mechanisms initiating convection during the COPS-Experiment Christoph Kottmeier Karlsruhe Institute of Technology and the COPS CI-group Christian Bartlott Klaus Beheng Andreas Behrendt Alan Blyth Ulrich Corsmeier R. Coulter George Craig Galina Dick Thomas Foken Paolo Di Girolamo Martin Hagen Christian HauckNorbert Kalthoff Christoph Kiemle Helmut Mayer Stephen Mobbs Evelyne Richard Reinhold Steinacker Andreas Wieser Volker Wulfmeyer Siegfried Vogt et al.
Cloud pictures during IOP 4b, 20/06/07 18 UTC near Freudenstadt (Nordschwarzwald Outline of talk During COPS, convection was initiated and developed much differently, depending on e.g. the instability of air masses, on the forcing from the surface and from the middle/upper troposphere. For improving QPF we need to understand the processes and predict convection not only on „golden days“ but generally for a wide range of synoptic situations. Can we generally identify the responsible initiation mechanisms ? What is their relative importance for CI? Which is the added value of the full COPS data set? Is there a useful statistical approach of understanding CI and its forcing mechanisms? Bilder: Marcus Engelhardt
CI factors considered for the whole COPS period 01/06 -31/08: 1) Identify initiation of deep convection -> MSG nowcasting products 2) Are near surface humidity and temperature favourable for cumulus- convection? -> AMF data set Is there potential instability of the atmosphere? -> AMF and DWD Stuttgart radiosondes Factors inhibiting convection -> AMF and DWD Stuttgart radiosondes 3) Convection inhibiting/enhancing CI in the middle/upper troposphere (vorticity-, advection, mean vertical motion) -> GFS analysis (via www.wetter3.de team)
1) Identify initiation of deep convection -> MSG nowcasting products June 20: IOP 4b June 20: IOP 4b
1) Identify initiation of deep convection -> MSG nowcasting products UW-CIMSS Satellite based Nowcasting and Aviation Application Team, supported by NASA and NOAA (www.cops2007.de)
2) Identify initiation of deep convection -> MSG nowcasting products • Locations of Convection Initiation • 15 min resolution • whole COPS period and region • resampled to 3 periods/day: • 6 UTC +- 3h, 12 UTC +- 3h, • 18 UTC +- 3h • 4 control regions • CI indicators: • CI in 0, 1, 2, 3, 4 of the regions • CI nowhere (0) or in any (1) of the 4 regions
2)Atmospheric stability, Convection indices High CAPE, Inversion at 820 hPa avoids CI from valleys FZK Radio-sonde Burnhaupt, southern Vosges, 08 UTC CAPE: 704 J/kg IOP 4b High moisture up to 650 hPa Inversion layer approx. 29 C needed to initiate cumulus
2)Atmospheric stability, Convection indices AMF: ARM mobile facility at Heselbach, Murg valley Continuous operation, 3-hourly radiosondes, convection indices DWD Stuttgart radiosonde Continuous operation, 12-hourly radio- sondes, convection indices Lifted Index Mixed layer lifted Index T0 – Ttrig Mixed layer T0 – Ttrig Surface based CIN Mixed layer CIN Surface based CAPE Mixed layer CAPE
3) Middle and Upper tropospheric forcing Quasigeostrophic Theory* (z replaced by zg) -> approx. vorticity equation and w-equation : vertical velocity in p-system : pressure : temperature : Coriolis parameter : geostrophic relative vorticity : diabatic heating : geostrophic wind vector : Coriolis parameter ref. latitiude : gas constant : specific heat at const. pressure : horizontal LaplaceOperator : isobaric gradient • Rising motion is forced in areas of • Positive advection of absolute vorticity, increasing with height • Relatively (to surroundings) largest warm air advection, weakest cold air advection • Relatively strongest diabatic heating, relatively weakest diabatic cooling Maps for COPS IOPs: http://www2.wetter3.de/ *Literature: "Synoptische Meteorologie" by Manfred Kurz. Leitfaden für die Ausbildung im Deutschen Wetterdienst. "Dynamik der Atmosphäre" by Helmut Pichler. Lehrbuch zur theoretischen Meteorologie.
3) Middle and Upper tropospheric forcing IOP 4b 500 hPa geopotential -- MSL pressure -- rel. topography Advection of abs. vorticity at 300 hPa Mean vertical velocity at 500 hPa w in hPa/h Analyse 12 UTC Analysis 18 UTC
4) Results 1 • Role of near surface air temperature and humidity • All days: 12 UTC +- 3h: • Trigger temperature not reached, too cold and dry at sfc • Trigger temperature almost reached in Murg valley, possibly reached over mountains or later that day
4) Results 2 • Role of near surface air temperature and humidity • All days: 12 UTC +- 3h: • CI happened in 1/3 of cases with Tsfca > Ttrigand CI was mostly suppressed for Tsfca > Ttrig • CI also happened in 2/3 of cases with Tsfca < Ttrig; down to -13 K in Murg valley: important role of mountain and slope/mountain circulations; possibly air mass convection originating from upper levels • Some cases of no CI although Tsfca > Ttrig in Murg valley; too low CAPE, high CIN
4) Results 3 • Role of CAPE • All days: 12 UTC +- 3h: • Isolated CI (CI=1) and widespread CI (CI=4) happened with relatively small CAPE • -> marginal CI conditions; airmass convection with upper level forcing? • Some cases without CI and CAPE up to 700 J/kg -> Trigger temperature not reached
4) Results 4 • Role of upper level forcing: differential vorticity advection (from GFS) • All days: 12 UTC +- 3h: • Differential vorticity advection: no significant difference of for situations w/o CI • Laplace of warm air advection: much larger variability and negative mean for situations with CI • Omega(500 hPa): larger variability but no mean difference for situations with CI • Problem: 1 deg resolution of GFS (0,5 deg for maps on www.cops2007.de)
4) Results • Summary: • CI index from MSG is a useful benchmark for diagnosing CI, comparing CI-relevant processes and CI model forecasts • CAPE, CIN (from AMF and other radiosondes) and surface triggering factors are consistently important as ingredients for CI over the whole COPS period. • Information about surface heterogeneity (mountains, mesoscale circulation, surface parameters and heating) and their model representation are indispensible for CI • The role of middle and upper tropospheric forcings are masked by the insufficient resolution of GFS (1 deg) data. • Needed for progress: mapped distributions of all relevant surface parameters, middle/upper tropospheric forcing factors from higher resolution modelling