Download
1 / 28
280 likes | 286 Vues
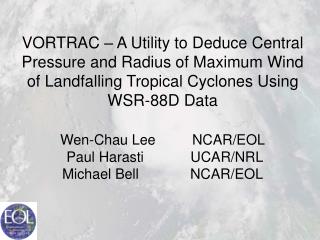
This utility utilizes WSR-88D data to deduce the central pressure and radius of maximum wind of landfalling tropical cyclones. It provides valuable insights for tracking and predicting cyclone intensification.

E N D
VORTRAC – A Utility to Deduce Central Pressure and Radius of Maximum Wind of Landfalling Tropical Cyclones Using WSR-88D DataWen-Chau Lee NCAR/EOL Paul Harasti UCAR/NRL Michael Bell NCAR/EOL
VTD-derived Axisymmetric Quantities: Vertical Velocity Angular Momentum Pressure Gradient
Charlie X: 0.56 km Y: 0.70 km RMW: 0.82 km VT: 1.9 m/s Katrina X: 0.86 km Y: 2.58 km RMW: 4.38 km VT: 9.00 m/s Confidence Level
VCP 12 VCP 121 WSR-88D Scanning Sequence
GBVTD Formulation: Vd: Doppler velocities VM: Mean flow VT: Tangential wind VR: Radial velocity w: Vertical velocity vt: Terminal velocity : Elevation angle : Angle in GBVTD coordinate : Azimuth angle M: Math angle of the mean flow Cn: Amplitude of cosine wavenumber n Sn: Amplitude of sine wavenumber n
VTD Formulation For L=3, M=N=2:
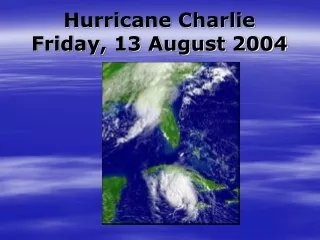
What have we learned from Charley? • Rapid intensification can occur near landfall • Coastal Doppler radar can effectively detect rapid intensification if they are operated properly • Vertical structure of the eyewall can provide indications on intensity change (e.g., more scans at lower angles are needed) • Most intense winds may occur in the eyewall but severe storms (e.g., tornado) may occur in the outer rainband precedes the arrival of the eye • Longer range is preferred over higher Nyquist velocity when setting scanning parameters