Download
1 / 44
450 likes | 739 Vues
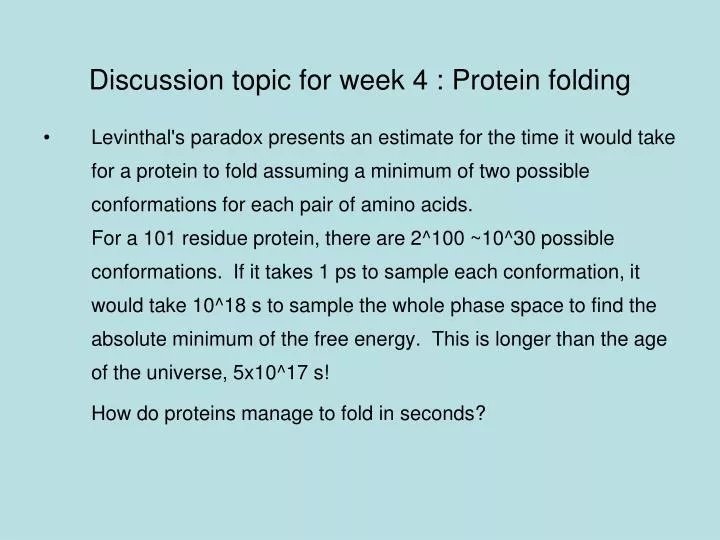
Discussion topic for week 4 : Protein folding Levinthal's paradox presents an estimate for the time it would take for a protein to fold assuming a minimum of two possible conformations for each pair of amino acids.

E N D
Discussion topic for week 4 : Protein folding • Levinthal's paradox presents an estimate for the time it would take for a protein to fold assuming a minimum of two possible conformations for each pair of amino acids. For a 101 residue protein, there are 2^100 ~10^30 possible conformations. If it takes 1 ps to sample each conformation, it would take 10^18 s to sample the whole phase space to find the absolute minimum of the free energy. This is longer than the age of the universe, 5x10^17 s! How do proteins manage to fold in seconds?
Chemical Forces(Nelson, chap. 8) Molecular machines in cells use chemical energy to function, and most of the time they do chemical work, e.g. synthesize proteins. To deal with this situation we need to consider more than one species and allow exchange of particles as well as energy. Let {Na, a=1, 2,…} denote the numbers of each species in a system The entropy of the system is a function of this set: S(N1, N2, …) We define the chemical potential for each species a as Recall the definition of the temperature (modified from the fixed N case) (availability of particles) (availability of energy)
When two systems, A and B, exchange only energy, thermal equilibrium is realized when TA = TB If they also exchange particles, their chemical potentials for each species a must be equal as well When two systems are not in chemical equilibrium, entropic forces arising from the difference in chemical potentials drive the system to equilibrium. As a simple example consider an ideal gas. The entropy is given by (Sakure-Tetrode formula) (chemical equilibrium)
Rewrite S using Stirling’s formula To obtain the chemical potential we need to keep the total energy fixed, where eis the internal energy. This is achieved by
The last term is just e/T. Substituting, we obtain for the chemical pot. Because we are interested in the number (or concentration) dependence of the chemical potential, we separate that term Where c0 is the reference concentration and m0 is the standard chemical potential
The reference concentration is introduced for convenience, it’s choice has no effect on the chemical potential. Convention: For gases at STP: c0 = 1 mole/22 L = 0.045 M For aqueous solutions: c0 = 1 mole/L = 1 M Notation: [X] = cx/c0 (e.g., [X] = 1 refers to a 1 molar solution) Rewrite the chemical potential as For ideal gases, the activity is simply given by the relative concentration. For solutions, the definition of m0 is more complicated. But if we treat it as a phenomenological parameter, we can use the same formulas for dilute solutions. (activity)
We can generalize the chemical potential by including the potential energy of the particles in the internal energy: In the case of charged particles, is called the electrochemical potential. Electrochemical equilibrium between two systems is achieved when Chemical reactions are controlled by the chemical potential of reactants: high concentration or high internal energy means higher availability. (Nernst relation)
Generalization of the Boltzmann distribution for particle exchange: Consider a small system “a” which can exchange both energy and particles with a much larger system B. Fluctuations in EB and NB are negligible but those in Ea and Na could be large. As we have shown before, the probability of “a” being in a state with Ea and Na is proportional to exp[SB(EB)/k] At equilibrium,
Thus the probability of “a” being in a particular state j with Ej and Nj is proportional to Using the grand partition function, The normalized probability becomes which is called the grand canonical distribution. The number of particles “a” contains depends on m; the larger m is, the more particles “a” will have.
Chemical reactions: As a simple case, consider a molecule which has two states with internal energies e1 and e2 (e.g. an isomer). Assume The chemical potentials are Chemical equilibrium: Non-equilibrium cases: 1. Reaction 1 2 proceeds (entropic forces do chem. work) 2. Reaction 2 1 proceeds (chemical en. converted to heat)
To summarize, when two systems are at equilibrium: • Temperatures and chemical pot’s are equal, • Total entropy S is maximum • Total free energy (F or G) is minimum Example: Burning of hydrogen Free energy change: At equilibrium: Assuming an ideal gas behaviour for all three participants, we can write for the free energy change
Here Keq is called the equilibrium constant of the reaction, and the ratio is called the reaction quotient Often a log scale is used for Keq :
For ideal gases (or dilute solutions), we can use the explicit expression derived for the standard chemical potential At low T, reaction favours H2O. As T increases H2 and O2 conc. also inc.
From chemical data handbooks, Keq at room temperature is given by: Clearly almost all the hydrogen will burn. Using the reaction quotient estimate the number of O2 molecules left from 1 mole of O2 gas None at all!
Generalization to arbitrary reactions: Assume n species involved in a reaction; k reactants and m-k products where nk are called the stoichiometric coefficients of the reaction The free energy difference is The reaction runs forward when DG < 0 and backward if DG > 0. DG = 0 corresponds to equilibrium. Again we separate the concentration dependent part from the rest
(Mass action rule) Setting DG = 0, we obtain where DG0 is the standard free energy change The values of DG0 for formation of molecular species can be found in chemistry handbooks (usually at STP; 298 K and 1 atm) When more than one reaction occurs at similar rates, there is a separate mass action rule for each reaction, which implies relations between the various ma .
Reaction Kinetics: Consider a typical reaction with rate constants k+ and k- Intuitively we expect the forward and backward rates to be proportional to the concentrations of molecules (first order reaction) At equilibrium, The above is true for single step reactions. For more complex reaction mechanisms, concentration dependence of rates may be different. (mass action rule)
In general, a reaction is of n’th order in species X if the rate depends on its concentration as (cX)n. An alternative 3-step mechanism for the previous reaction, which is second order in X2 and zeroth order in Y2 : Each step must be in equilibrium (slow, rate limiting step) (fast) (fast) Product: (mass action rule is independ. of mechanism)
Dissociation: Salts, acids, bases and polar molecules readily dissolve in water because the loss in potential energy is more than compensated by the interaction of the charged parts with water molecules (charge-dipole and H-bond) and gain in entropy. Example: Dissociation of water From conductance measurements in pure water: Mass action rule: Adding an acid (e.g. HCl) increases [H+] and hence lowers [OH-] Adding a base (e.g. NaOH) increases [OH-] and hence lowers [H+] (proton + hydroxyl)
In chemistry, the amount of protons in a solution is described by its pH Pure water has pH = 7, which is called normal pH Adding acids in water lowers pH. A solution with pH < 7 is called acidic Adding bases in water raises pH. A solution with pH > 7 is called basic Common acidic and basic groups in organic molecules: Carboxyl group Amine group protonated deprotonated Of the 20 amino acids, aspartate and glutamate have acidic side chains while arginine and lysine (~histidine) have basic side chains.
Probability of protonation of a side chain equilibrium: When
Examples: Aspartic acid: Keq = 10-3.7 Pa = 1/(1+10+3.3) 0 (has charge –e) Arginine: Keq = 10-12.5 Pa = 1/(1+10-5.5) 1 (has charge +e) The average charge on a side chain is determined by Pa Acidic side chain: q = –e (1 – Pa) Basic side chain: q = e Pa Note that the pH of the solution controls the protonation state of a protein. In titration experiments, the pH is varied over a wide range, e.g. 1-12. When pH < pK of all the side chains, all are protonated (max + charge) As pH increases, and goes through pK of an acidic side chain, q = 0 –e Beyond pH = 7, basic side chains start deprotonating, q = +e 0 For pH > pK of all the side chains, all are deprotonated (max – charge)
Titration curve of ribonuclease. As pH is raised protein loses protons.
Electrophoresis: As the titration curve indicates, apart from a critical pH value, proteins carry a net charge and hence will move under an applied electric field. This process is called electrophoresis. A common application is separation of proteins, which is achieved by setting the pH of the solution at the critical value of the protein we want to separate and applying an electric field. Varying pH and measuring the electrophoretic mobility, one can determine the critical pH value precisely. A famous example is Pauling’s finding of the cause of sickle-cell anemia. Patients carry a defective hemoglobin that differs from the normal one by a single point mutation, Glu Val. Glu has –e (pK = 4.25), Val is neutral. At pH = 6.9, the two proteins migrate in opposite directions!
Self-assembly of amphiphiles: How do the cell membranes form? Amphiphiles: molecules that have both hydrophilic (polar) and hydrophobic (CH2 chain) parts (detergents, lipids) Sodium dodecyl sulfate (SDS) Phosphatidylcholine
When detergents are added to oil-water mixtures, they form a boundary between the two such that the polar head groups face water and hydrophobic tails face oil Oil-water interface stabilized by detergent oil-water emulsion
Micelle formation: When detergent is added in pure water, they form small spherical objects just like in the emulsion case. The only difference is that the tails avoid water by facing each other. N=5 N=30 Osmotic pressure: P = ckT (McBain, 1944)
Let the number of detergent molecules in a micelle be N, and denote the concentration of micelles by cN and monomers by c1 The reaction is: (N monomers) (micelle) Mass action rule (MAR) at equilibrium: Experimentally measured quantity is the critical micelle concentration, c* which is defined as, substitute in MAR substitute in ctot For 2c1 << c*, ctot = c1, while for 2c1 >> c*, ctot = NcN
Coarse-grained models of lipid aggregation: United atom models of lipids Micelle formation (Klein et al. 2004) Bilayer formation (Marrink et al. 2001)
Cooperative transitions in macromolecules (Nelson, chap. 9) Biological molecules usually have two distinct conformations: random coil form of the polypeptide chain and a folded compact form. Examples: • Helix-coil transition in a simple amino acid chain • Full folding of a protein from random coil to a compact 3D structure • An extreme example is the condensation of DNA, where the full length of about 1 m is squeezed into a micron size nucleus. An important parameter in characterizing the elasticity of polymers is the persistence length, which determines the length scale for bending of the chain of molecules. Persistence length is typically about 1 nm for polymers, which are very flexible. In contrast, it is about 100 nm in DNA, which is relatively very rigid.
Elasticity model of polymers: If we model polymers as a continuous elastic object, there are three possible deformations: a) bending, b) stretching, c) twisting (torsion) Because the covalent bonds in polymers are quite rigid and the torsional motion is restricted, only the bending deformation is important (for ¼ circle)
Stretching of DNA (experimental data from DNA of lambda phage) A force of few pN is sufficient to fully stretch DNA from a random coil. At 65 pN DNA takes another form, where the backbone is straightened.
Two-state model of DNA stretching (freely jointed chain model in 1D) Assume DNA consists of N segments of length Ls, which can be oriented in +z or –z direction. Apply a force f in the z direction to stretch it. The corresponding potential is U= –fz where z is the DNA length given by Probability of a particular configuration [σ1,….,σN] is given by the Boltzmann factor Where Z is the partition function
Taking the derivative wrt f gives Introducing Ltot=NLs The limiting cases: 1) High force (f>>kT/Ls), 2) Low force (f<<kT/Ls), At low force, a polymer behaves like a spring, obeying Hooke’s law
Ls=35 nm Comparison of theory with experimental data from lambda phage Ls=104 nm Long-dash curve: 1D cooperative chain model (includes elastic energy) Short-dash curve: 3D freely jointed chain model
Helix-coil transition (experimental data from an artificial polypeptide) • At a critical temperature polypeptide makes a transition from coil to helix • Transition is sharpened with the number of residues (cooperative effects)
Energetics of helix-coil transition The free energy change in the transition is given by From experiments: Introduce a parameter which measures favourability of extending the helix formation
When a vanishes, extending the helix by one unit makes no change in the free energy Using a cooperative 1D freely jointed model and The curves in the previous figure are obtained by fitting this expression to the data points.
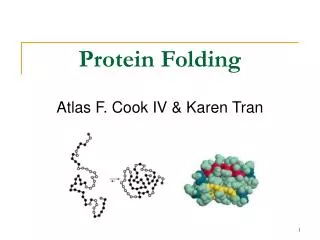
Protein folding: • Primary sequence determines the folded structure • The free energy gain from folding is about 20 kT • Loss of entropy is compensated by H-bond formation and especially hydrophobic interactions (Kauzmann, 1950s). • Changes in the environment can lead to denaturation (unfolding) of proteins. For example, proteins unfold • at both high (T > 50 C) and low (T < 20 C) temperatures • in nonpolar solvents • in the presence of small amounts of surfactants
MD simulations of protein unfolding at high temperatures (Daggett et al.) Unfolding of engrailed homeodomain Folding time at 298 K, ~1 ms
Potential energy landscapes for protein folding: a) Flat (i.e. Levinthal) b) Ant trail c) Smooth funnel d) Rugged funnel
Rugged protein folding pathways from lattice calculations (Dill et al)