Download
1 / 32
320 likes | 463 Vues
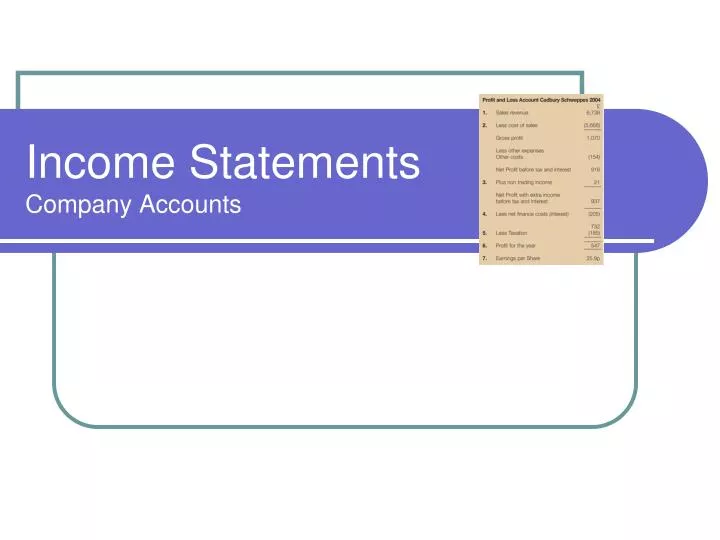
Income Statements Company Accounts. Lesson Objectives. By the end of this lesson, learners will have knowledge and understanding of: An Income Statement Its uses and limitations How to construct a simple Income Statement. Different headings – what do they mean?

E N D
Lesson Objectives • By the end of this lesson, learners will have knowledge and understanding of: • An Income Statement • Its uses and limitations • How to construct a simple Income Statement. • Different headings – what do they mean? • The key terms used in a Income Statement and their meaning
Income Statement • A record of a business’s trading activities over a period of time. • Usually one year. • Basically, shows: • How much the firm has earned from selling its products or services [Revenue] • How much it has paid out in costs [Costs] • The net of the above = PROFIT!
Interested Parties • The Income Statement constitutes two vital pieces of information to those interested in a business. • Shareholders are an obvious example of stakeholder assessing profitability. • Government agencies such as the Inland Revenue require data on profit or losses to be able to calculate tax liabilities of a company. • Suppliers to a business also need to know the financial position of companies they trade with. • Reliability, Stability and Creditworthiness. • Potential shareholders and bankers will also want to assess the financial position of company before committing their funds.
Uses of Income Statement • Can be a measure of success of a business compared to other years. • The calculation of profit can assess the actual performance of a business against expectations. • It can help obtain loans or finance from banks or other leading institutions. • Can help the owners and managers of a business to plan ahead, i.e. future investment.
Profit – to be or not to be! • Making a profit is the ultimate objective of any business. • However, other business have other motives. • Charities – Redistribute resources • Co-op, building societies and many social clubs – excellent customer services. • All businesses must ensure to generate enough to at least match costs.
Income Statement • The Income Statement itself is actually divided up into sections: • The Trading Account - Calculates the gross profit made on trading activities. • The Profit & Loss Account – Calculates the overall level of profit made by a business. • The Appropriation Account – Concerned with showing how any profits made by the business have been distributed.
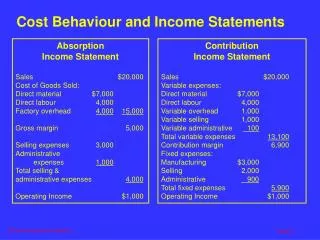
Turnover/Sales Less Cost of Sales = Gross Profit Less Expenses = Operating Profit Plus Non-Operating Income Less Interest Payable = Profit on ordinary activities Less Corporation Tax = Profit after Tax Less Dividends = Retained Profit Layout for an Income Statement Trading Profit and Loss Account Appropriation Account
Activity • Think of examples of as many items as you can that will appear in each of the three sections of an Income Statement • Trading Account • Profit and Loss Account • Appropriation Account
Measuring Profits • Profit = (Revenue) minus (Costs) • However, to be more meaningful, profit should be broken down into: • Gross Profit • Net Profit
Turnover/Sales Revenue Shows the income from selling goods and services. Goods manufactured but not sold to customer are excluded. Goods which have been sold to the customer, but payment not received is included. Turnover/Sales Revenue
Cost of Sales Refers to all costs of production. Includes direct costs such as: Raw Materials Wages of labour Other indirect costs associated with production. Fuel and Rent Cost of Sales
Example – Cost of Sale • Stock at 1st April 2001 £4,000 • Add: Purchases during the year £14,380 £18,380 • Less: Stock at 31st March 2002 £4,500 • Cost of Sales £13,888
Your turn (on your own) • Have a go at this example. • A business starts the year with £3400 stock • It ends the year with £2800 stock • It purchases £23100 during the year. • What is the cost of sales?
Example – Cost of Sale • Opening Stock £3,400 • Add: Purchases during the year £23,100 £26,500 • Less: Closing Stock £2,800 • Cost of Sales £23,700
Gross Profit A measure of the difference between turnover and the cost of manufacturing and purchasing the products which have been sold. Gross Profit does not include expenses or overheads. If a company is making a lower level of gross profit then are they paying too much for supplies? Gross Profit
Overheads/Expenses Those overheads or indirect costs that are not involved in the production of goods and services. Subtracting expenses from gross profit gives a figure for OPERATING PROFIT/NET PROFIT. Salaries & Wages Rent, Rates & Insurance. Depreciation Heating & Lighting Repairs Delivery Costs Salesmen’s Salaries Advertising Rent, Rates & Insurance of Sales office. Interest of Loans Heating & Lighting Overheads/Expenses
Net Profit Gross Profit – (expenses + overheads) = Net Profit Operating profit is often regarded as a key indicator of trading performance. Profit made by a business from its ordinary trading activities. Often termed operating profit. A large gross profit does not mean a large net profit. Costs may not be managed and controlled effectively = low net profit. Net Profit
Gross Profit Margin Basically, this ratio shows how well the organisation is managing its purchases of stock. This ratio examines the relationship between the profit made before allowing for overhead costs in relation to turnover. Types of Ratio
Net Profit Margin Shows how well the business manages its other expenses. This calculation takes the idea of profitability one step further. The relationship between the net profit and the level of turnover/sales made after all other expenditure has been taken out is measured. Net Profit Margin Ratio
Use the data and template provided to draw up a profit & loss account 15 minutes (ish!) If you finish – calculate the gross and net profit margin Calculating Profit - Activity
Consolidated Profit & Loss Account for the year ended 2003 2002 2001 Weeks 52 52 52 Currency £ million £ million £ million Turnover 7688.0 8340.0 9278.0 Cost of sales -7263.0 -8291.0 -8757.0 Gross Profit 425.0 49.0 521.0 Operating Expenses -130.0 -137.0 -77.0 Operating Profit 295.0 -88.0 444.0 Other costs/income 95.0 166.0 -68.0 Profit before interest and taxation 390.0 78.0 376.0 Net interest receivable (payable) -255.0 -278.0 -226.0 Profit on ordinary activities before taxation 135.0 -200.0 150.0 Tax on profit on ordinary activities -50.0 -71.0 -69.0 Profit on ordinary activities after taxation 85.0 -129.0 81.0 Equity minority interests -13.0 -13.0 -14.0 Profit for the financial period 72.0 -142.0 67.0 Dividends 0.0 -193.0 Retained profit 72.0 -142.0 -126.0 Income Statement Dividend – the share of the profit returned to shareholders Retained Profit – the amount kept back for future investment, etc. Profit and Loss Account for British Airways plc Source: http://www.bized.ac.uk/cgi-bin/ratios/ratiodata.pl Turnover – the revenue earned over the year Operating or Net Profit = Gross profit – operating costs Cost of Sales – the variable costs, how much it cost the firm to produce what it has sold – not to be confused with sales revenue! Subtract other costs and expenses incurred to get profit before tax Final section called ‘appropriation account’ – shows where the profit/loss is going Gross Profit = turnover – cost of sales Operating Expenses – the fixed costs Subtract interest payments/receipts to get profit on ordinary activities before tax Subtract tax due to get profit on ordinary activities after tax
Profit Quality • Profit quality measures whether or not individual profit sources will continue. • Make one off profits from the sale of Assets = Low Profit Quality • A company with strong trading position, which is expected in future years = High Profit Quality.
Limitations of Income Statement • Profit and Loss cannot be used to show what is going to happen in the future. • Historical information used. • However, can be used to identify possible future trends by looking at the profit or loss over a longer period of time. • Investors/stakeholders must appreciate that the figures could be disguised or manipulated. • Hide its profit to reduce tax or to deter a potential takeover. • A business may try to show a greater profit to satisfy shareholders.
Interpretation • A gross profit percentage of 5% means the firm makes a £5 gross profit on every £100 of goods sold. • A gross profit percentage of 85% means the firms makes £85 gross profit on every £100 of goods sold. • There is no ideal level for this percentage – it depends on the type of business.
Interpretation • The higher the profit margin a business makes the better. • Gross profit margins vary considerably between different markets. • Gross profit margins for clothes is higher than food. • Previous year figures used for comparable purposes. • Establishes whether or not the firm’s trading position has become more or less profitable. • Any results gained should be looked at in the context of the industry sector.
Reasons for a fall • Possible reasons for a fall in gross profit percentage could be: • Cash losses – theft from sales taking. • Stock losses – theft by staff, shoplifting or wastage. • Price reductions (e.g. having sales). • Increase in cost of goods purchased from suppliers without a corresponding increase in prices of these goods sold to customers. • Stocktaking errors. • ↑ in goods will not increase the gross profit percentage.
Altering the Ratio • Gross profit margin can be improved by: • Raising sales revenue whilst keeping the cost of sales static or low. • Reducing the cost of sales (raw materials used to make the products) made whilst maintaining the same level of sales revenue (total money in).
Interpretation • A higher percentage result is preferred. • The net profit margin establishes whether the firm has been efficient in controlling its expenses. • Should be compared with previous years figures and with other companies in the same industry. • Should also be compared with Gross Profit Margin. • Gross Profit Margin may have improved while Net Profit Margin declined. • Profits made on trading are rising, but overhead expenses are increasing at even faster rate and thus cutting into the profits.
Altering the Ratio • Net Profit Margins can be improved by: • Raising sales revenue whilst keeping expenses low. • Reducing expenses whilst maintaining the same level of sales revenue.
Thank you for Listening! Question & Answer