Download
1 / 20
200 likes | 299 Vues
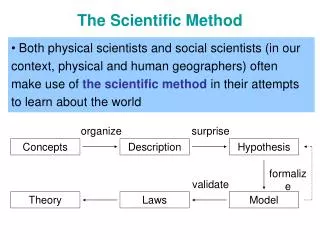
The Scientific Method. Honors Biology Laboratory Skills. The Scientific Method. Making Observations Asking Questions Forming a Hypothesis Designing an Investigation Testing the Predictions (Collecting, analyzing, processing data) Conclusion. Hypotheses and Predictions.

E N D
The Scientific Method Honors Biology Laboratory Skills
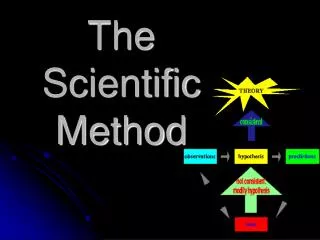
The Scientific Method • Making Observations • Asking Questions • Forming a Hypothesis • Designing an Investigation • Testing the Predictions (Collecting, analyzing, processing data) • Conclusion
Hypotheses and Predictions • A scientific hypothesis is a possible explanation for an observation or a scientific problem that is given to you. Its characteristics: • It offers an explanation for an observation • It refers to only one independent variable • It is written as a statement • It is testable by experimentation • It is based on research, observations or prior knowledge • It leads to predictions about the system (or the topic of your experiment)
Hypotheses…let’s give it a try! • Example 1: During an experiment on bacterial growth, the girls noticed that bacteria in cultures grew at different rates when the dishes were left overnight in different parts of the laboratory. (This is an observation) • Hypothesis:
Hypotheses…one more try! • Example 2: Observation – During an experiment on plant cloning, a scientist noticed that the root length of plant clones varied depending on the concentration of a hormon added to the agar. • Hypothesis:
Variables • You must identify the variables that you are testing and the ones that you keep constant. • A variable is any characteristic or property that is measurable or observable. • You must use units with your variables • Types of variables: • Independent variable • Dependent variable • Controlled variable
Independent Variable • Set by the person carrying out the investigation (ex. Temperature, light intensity, pH) • Recorded on the x axis of the graph during data presentation • There is always only one in an investigation • Must record proper unit
Dependent Variable • Measured during the investigation (ex. Plant growth, heart rate etc) • Recorded on the y axis of the graph during data presentation • There is always only one in an investigation • Must record proper unit
Controlled Variables • Factors that are kept the same or controlled. • List these in the method as appropriate to your own investigation
Let’s play with variables! (don’t need to write this down) • Look at the picture and explanation on the board on catalase activity and answer the following questions: 1. Write a suitable hypothesis for this experiment: 2. Name the independent variable with the proper unit: ___________________________ 3. List the equipment needed to set the independent variable, describe how it was used: 4. Name the dependent variable with the proper unit: ___________________________ 5. List the equipment needed to measure the dependent variable, describe how it was used: 6. List three variables that might have been controlled in this experiment:
Data Collection • Design a data table to record your results. Your data table should clearly show the units and values of the independent and dependent variables.
Data Presentation -- Types of Graphs • Some examples that we use this year: • Line Graph • Bar Graph • Pie Graph • Your graphs should always include the following: • Labeled axes with units • Connected dots for line graphs • Proper scale • Title of the graph
Line Graph • Line graphs are used when one variable (called the independent variable), affects another, the dependent variable. • The data for line graphs must be continuous for both variables.
Bar Graph • The data for this graph are non-numerical and discrete for at least one variable, in other words, they are grouped into separate categories. There are no independent or dependent variables. • The data are discontinuous, so the bars do not touch • Multiple data sets can be displayed using different colored bars placed side by side within the same category.
Pie Graphs • The entire chart always represents 100% • Must determine what the 100 % (whole pie) stands for. • Best to use when we compare parts of a whole. Land Use in North Carolina
What Is a Scientific Model? • A scientific model is a representation of an object or system. An example of a scientific model would be a diagram of a cell or a map .. Even a model rocket! • Any model is based on a certain set of observations. A good model must be able to explain as many characteristics of these observations as possible, but also be as simple as possible.
And as a review, watch: http://www.youtube.com/watch?v=jPaGOHwv7mQ