Download

1 / 36
360 likes | 364 Vues
This study evaluates the effects of CTB/McGraw-Hill's Acuity Assessment Program on instructional practice and student achievement in Indiana schools. The findings and implications are discussed.

E N D
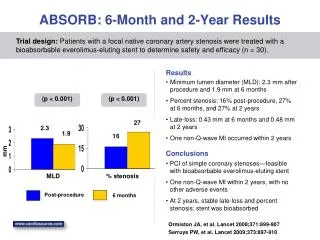
The Indiana Acuity Efficacy Study: Year 2 Results and Implications Terry Spradlin Bridget Schleich June 21, 2010 CCSSO National Conference on Student Assessment
About the Center for Evaluation & Education Policy • The Center for Evaluation & Education Policy (CEEP) is a client-focused, self-funded research center associated with the School of Education at Indiana University • CEEP promotes and supports rigorous program evaluation and nonpartisan policy research primarily, but not exclusively, for education, human service and non-profit organizations • In the area of K-12 education policy, CEEP’s mission is to help inform, influence and shape sound policy through effective, nonpartisan research and analysis • www.ceep.indiana.edu
Contents • Indiana’s Comprehensive Assessment Plan • 2009-10 Testing Schedule (formative and summative) • Objectives of Efficacy Study in Indiana • Study Design and Methods • Findings for Each Qualitative Analysis • Overall Summary of Qualitative Findings
I. Indiana’s Comprehensive Assessment Plan • Adopted by the Indiana State Board of Education on November 1, 2006 • Plan called for moving the Indiana Statewide Testing for Educational Progress-Plus (ISTEP+) from Fall to Spring and the implementation of formative/diagnostic assessments • Features implemented during the 2008-09 school year: • Wireless Generation’s mClass Reading 3D and Math (Grades K-2 formative) • CTB/McGraw-Hill’s Acuity Assessment Program (Grades 3-8 formative) • Phase-out of the Graduation Qualifying Exam (GQE) • Class of 2011 last to be required to pass GQE • To be replaced with end-of-course assessments in core subject areas • Moved ISTEP+ from Fall to Spring • (Students in grades 3-10 were tested twice during the 2008-09 school year)
II. 2009-10 Spring Testing Schedule (Formative and Summative)
III. Objectives of Efficacy Study in Indiana Objectives of CEEP Study: • Evaluate the effects of CTB/McGraw-Hill’s Acuity Assessment Program, a formative assessment system, on instructional practice and student achievement, particularly ISTEP+,for Acuity schools • Information intended to inform CTB and the IDOE about the kind of support needed to make the implementation of Acuity most effective during subsequent school years
IV. Study Design and Methods Qualitative and Quantitative Methods • Spring Statewide Online Survey of Acuity Schools • Intensive Case Study • Completion of a Comparison-Group Study
Study Design and Methods Spring Statewide Online Survey of Acuity Schools • Measure attitudes and perceptions of teachers and administrators on the benefits and outcomes of their participation in the Acuity Assessment Program during the 2009-10 school year • Survey window was open from April 12 to April 30, 2010 • 1029 respondents included 655 (64%) teachers, 198 (19%) principals, 70 (7%) testing coordinators, and 106 (10%) other school personnel
Study Design and Methods Spring Statewide Survey (cont.) Questions probed: • Educator opinions regarding Acuity Assessment Program content, technology/user experience, professional development, and customer support after use of the system for a full school year or more were assessed • In addition, a primary objective of the survey to obtain suggestions for improvement of the program and to gauge views regarding the impact of the program on classroom instruction, general student achievement, and student achievement on ISTEP+
Study Design and Methods • Spring Statewide Survey (cont.) • 2 Surveys were available : • Schools in Year 1 : 16-question survey • Schools in Year 2+: 18-question survey • Questions were identical on both surveys; however, Year 2+ schools were additionally asked: • The frequency with which they are using the Acuity tools (e.g. not using the tools; beginning to use the tools; using the tools extensively, etc.) • The extent to which they are using the Acuity data (e.g. not using the data; using Roster Reports; using Assessment Reports, etc.) to alter or inform instruction
Study Design and Methods Qualitative Methods Intensive case study • Determine what factors make a difference in the effective implementation of Acuity and use of Acuity data • Extent to which schools have implemented the Acuity Assessment Program and identify obstacles encountered • Extent to which Acuity has altered or informed classroom instruction, and impacted general student achievement as well as ISTEP+ performance
Study Design and Methods Intensive Case Study (cont.) • The Project Team identified 11 schools (9 elementary schools; 6 middle schools) for the case study that were reflective of Indiana’s student population based on prior ISTEP+ performance, free and reduced-price meal program eligibility data, school size, and local type (urban, suburban, and rural) • Additionally, the Project Team identified four schools with significant scale score improvement from fall to spring ISTEP+ during the 2008-09 school year • Qualitative procedures included one-on-one, face-to-face interviews with 34 principals, testing coordinators, and Acuity trainers as well as focus groups with six to 10 teachers in all 15 schools (109 teachers total); conducted 2/03/10 through 4/06/10
Study Design and Methods Quantitative Methods Completion of a Comparison-Group Study • Using matching, regression and other statistical techniques to analyze quantitative data collected from the Acuity Predictive and Diagnostic assessments as well as from Indiana’s ISTEP+ summative assessment • These analyses will be used to assess the degree to which use of the predictive and diagnostic assessments are associated with increased achievement on the state-required summative assessments in mathematics and English/language arts • Comparison schools will be matched with Acuity schools using prior ISTEP+ performance, free and reduced-price meal program data, race/ethnicity, school size, and local type (urban, suburban, and rural) • CEEP will subsequently conduct a longitudinal study adding 2009-10 data to the aforementioned analyses to monitor performance differences from one school year to the next.
V. Findings for Each Qualitative Analysis A. Spring survey B. Case Study Site Visits • Positive Educator Feedback • Pressing Issues • Educator Recommendations and Considerations
A. Spring Survey Results: Findings, Opinions, and Suggestions
Frequency of Formative Assessment Use • Respondents most commonly used the program only during administration windows.
Other Frequency of Use Issues • Most Acuity schools (78% for Year 1 schools; 74%, Year 2+) used the online tools exclusively in their administration of the Acuity Assessment Program • 21% of Year 1 and 20% of Year 2+respondents use both online and paper/pencil tests. • Educators are not using all components of Acuity as often as necessary to maximize the use and benefits of the system • e.g., only 45% of Year 1 respondents and 47% of Year 2+ respondents indicated using the Instructional Resources; only 18% of Year 1 and 26% of Year 2+ respondents indicated using the Item Bank
Perceived Impact on Classroom Instruction • A majority of respondents (63.5% in Year 1 schools; 65.6%, Year 2+) indicated that participation in the Acuity Assessment Program helped to somewhat improve classroom instruction • 19.4%/22.7% felt participation had no impact on instruction • 6.3%/5.5% indicated that participation led to a decreased quality of instruction (due to the multiple assessments scheduled during the school year, both formative and summative, limiting instructional time) • When comparing last year’s spring survey findings to schools in Year 2+ this school year, the percent of respondents who felt Acuity had at least somewhat improved classroom instruction increased from 51% to 66%
Perceived Impact on Student Achievement • The majority (63.5% in Year 1 schools; 61.9%, Year 2+) of respondents indicated that participation in the Acuity Assessment Program during the 2009-10 school year led to somewhat improved student achievement outcomes • Opinions of the impact of Acuity on student achievement were very similar in schools using Acuity for the first time and schools in year 2+ • From last spring’s statewide survey of Acuity during the 2008-09 school year, 45% of respondents felt Acuity somewhat improved (43%) or greatly improved (2%) student achievement. Over the course of one year, respondents’ opinions improved 20 percentage points overall regarding the influence of Acuity on student achievement.
Perceived Impact on Student Performance on ISTEP+ • A majority (70.2% in Year 1 schools; 58.6%, Year 2+) of respondents indicated that they anticipated participation in Acuity will lead to somewhat improved student performance on the Spring 2010 ISTEP+ • 23.6%/36.0% stated that participation would have no impact on student ISTEP+ scores • Year 1 schools were more optimistic about Acuity’s impact on ISTEP+ scores • In the 2008-09 Spring Survey, 49% of respondents believed Acuity somewhat improved ISTEP+ performance as compared to 59% of Year 2+ respondents this 2009-10 school year. This indicates an increase of 10 percentage points in respondents positive perception regarding the impact of Acuity on student ISTEP+ performance.
Impact on Instruction and/or Student Achievement: Year 1 Group (Q 11) Why do you think classroom instruction and/or student achievement declined, improved, or did not change? Of the 296 written responses: • For those who believed Acuity led to improvement in classroom instruction and/or student achievement, the largest number of respondents (44) cited that Acuity shows student strengths, weaknesses, and/or areas for improvement. • For those who believed Acuity led to no change in classroom instruction and/or student achievement, the largest number of respondents (27) cited that the test’s impact could not yet be determined. • For those who believed Acuity led to declined classroom instruction and/or student achievement, the largest number of respondents (25) indicated students were being tested on material they didn’t know yet.
Impact on Instruction and/or Student Achievement: Year 2 Group (Q 13) Why do you think classroom instruction and/or student achievement declined, improved, or did not change? Of the 424 written responses: • For those who believed Acuity led to improvement in classroom instruction and/or student achievement, the largest number of respondents (93) cited that teachers are better able to target teaching and instructional materials based on demonstrated student needs. • For those who believed Acuity led to no change in classroom instruction and/or student achievement, the largest number of respondents (64) reported educators are not using all of the Acuity resources available. • For those who believed Acuity led to declined classroom instruction and/or student achievement, the largest number of respondents (37) indicated students were not taking Acuity seriously because of boredom, frustration, or because they knew they were not being graded.
(Q 13) What was the most helpful component of the Acuity Assessment Program? (Year 1) • Nearly half of respondents from Year 1 schools indicated Data and Instructional Resources were the most helpful component • Teachers especially appreciated the Matrix Reports and having data available immediately
(Q 15) What was the most helpful component of the Acuity Assessment Program? (Year 2+) • Acuity reports were frequently cited as the most helpful component (34.8%) • 71 of 77 respondents who cited data mentioned using data to drive instruction
(Q 14) How can CTB/McGraw-Hill enhance the Acuity Assessment Program for future assessment administrations? (Year 1) • The largest number of respondents (34.3%) cited the need for further alignment of Acuity, ISTEP+ and curriculum pacing • Content concerns included need for more questions per standard (especially in science and social studies) and less repetition of material
(Q 16) How can CTB/McGraw-Hill enhance the Acuity Assessment Program for future assessment administrations? (Year 2+) • The largest number of respondents (93 out of 426) indicated they would like improvements to Instructional Resources, especially ease of assigning and automatic assignment • 15.3% of respondents were concerned with the difficulty of use for students, including technological concerns like scrolling in a window, aesthetics, and special needs accommodations
B. Case Study Results: Site Visit Findings, Suggestions, and Implications
Positive Educator Feedback • The program helps teachers identify skills and standards with which students struggle; many use it to help guide instruction • Teachers found the step-by-step approach for student use of the Instructional Resources extremely helpful • Teachers liked Acuity’s relation to ISTEP+, including comparability of questions and providing clear information to the student and teacher alike if the child is on target for passing ISTEP+ • Teachers using the Diagnostic test appreciate aligning instruction with the test • Students are navigating the Predictive assessment system more easily now that they are used to it
Positive Educator Feedback (cont.) • Teachers reported that giving the Predictive assessment is fairly straightforward • Teachers who understand how to create and utilize reports are doing so, particularly batch reports, class rosters and Matrix reports • Educators are pleased with the response from the Help Desk • Teachers and students liked the clickers and said their use decreases cheating • The majority would continue using Acuity if the decision was theirs alone
Pressing Issues Timing and Scheduling • Acuity Predictive C is too close to the ISTEP+ window to be useful • Time constraints impede feasibility of accessing reports and assigning Instructional Resources, lab time, etc. • Material students are being tested on is not aligned with the curriculum causing frustration for both teachers and students Instructional Resources • Instructional Resources are complicated to assign and monitor • Instructional Resources need more questions for each standard and variety • Assigning Instructional Resources is time consuming to the point that negative experiences are diminishing teacher use of the system Professional Development • Teachers would appreciate hands-on, differentiated training
Pressing Issues (cont.) Student Experiences • Acuity is not engaging for all students • Vocabulary used is too difficult • Constructed Response is too time consuming and seems pointless to many since the score is not calculated into the final grade • Acuity is not adaptable or appropriate for lower-ability students Reports and Data • Parent reports are needed that are easy to understand and readily accessible
Educator Recommendations & Considerations • Improving Student Experiences with Acuity • Teachers recommended that CTB/McGraw-Hill makes Acuity more visually appealing when students receive their results; this may be a gateway to providing motivation to improve. • Students should be required to review items they answered incorrectly, and retests should be an alternate form which tests the same content. • One suggestion for dealing with difficult vocabulary was to provide an easy definition of a word which appears when a cursor scrolls over it. • Teaching Strategies • Teachers would like to be able to personally arrange questions to more closely align with their schools’ curriculum pacing. • The vast majority of teachers would like an auto assignment feature added to the system to assign Instructional Resources to students below a certain threshold on either the Diagnostic or Predictive assessments. • Tips From Educators • Educators would like an easily accessible parent report that can be pulled up during meetings. The report should indicate areas in need of attention; should be easy for all parents to understand; and should help teachers indicate whether a child is expected to pass the ISTEP+.
V. Overall Summary of Qualitative Findings • The program helps teachers identify skills and standards with which students struggle allowing for instruction to better meet the needs of students • Teachers desire more training on using student and class data to inform and improve instruction • Educators expressed high levels of satisfaction with customer service and attentiveness by CTB • Teachers and students alike enjoy the clickers (student response devices) • Educators offered many suggestions for modification to Acuity; CTB appears to be listening
Summary of Qualitative Findings (cont.) • Some teachers expressed concern regarding the alignment between Acuity and the curriculum • Educators would like to see the initial assignment and reassignment of Instructional Resources made easier. They would also like to see an automatic tracking component of assigned Instructional Resources • Questions on the test as well as in the Instructional Resources need to be improved. This can be done by limiting repetition of material and ensuring adequate content is available for addressing each standard • The full impact of Acuity is yet to be determined, but more educators are becoming optimistic about the impact of Acuity on classroom instruction, student achievement in general, and on ISTEP+ in particular.
CEEP Contact Information Terry E. Spradlin, MPA Associate Director for Education Policy tspradli@indiana.edu Bridget Schleich Graduate Research Assistant bschleic@indiana.edu 1900 East Tenth Street Bloomington, Indiana 47406-7512 812-855-4438 Fax: 812-856-5890 http://ceep.indiana.edu