Download
1 / 30
300 likes | 431 Vues
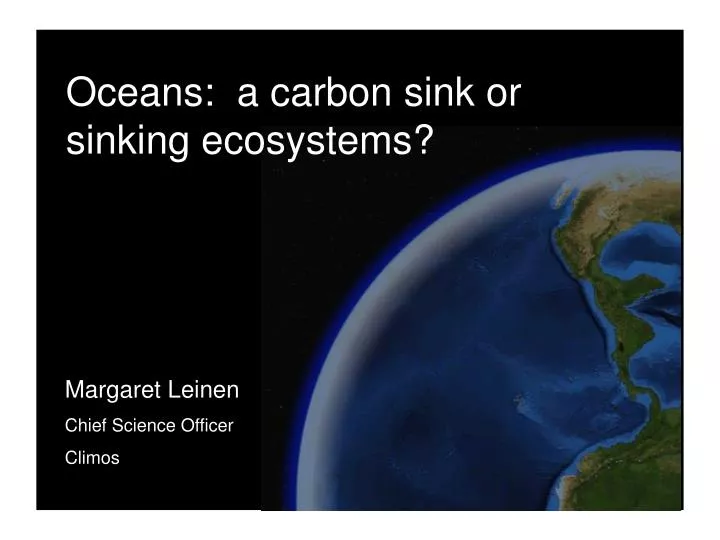
Oceans: a carbon sink or sinking ecosystems?. Margaret Leinen Chief Science Officer Climos. 1. What is the role and status of the ocean as a carbon sink? How is increased CO2 affecting the ocean and its ecosystems?. Plankton grow, mature and die—taking carbon with them to the deep ocean

E N D
Oceans: a carbon sink or sinking ecosystems? Margaret Leinen Chief Science Officer Climos 1
What is the role and status of the ocean as a carbon sink? How is increased CO2 affecting the ocean and its ecosystems?
Plankton grow, mature and die—taking carbon with them to the deep ocean They have a larger effect on climate than any single other process or group of organisms. Of the ~750 billion tons of CO2 that turn over annually, plankton process 45% 99% of marine life relies on plankton—they form the base of the marine food chain. 45% of annual carbon flux is processed by phytoplankton THE BIOLOGICAL PUMP 3
The biological pump efficiently transfers carbon to the deep ocean 4
1970 – 1979: 1.3 ppm y-1 1980 – 1989: 1.6 ppm y1 • 1990 – 1999: 1.5 ppm y-1 • 2000 - 2006: 1.9 ppm y-1 Atmospheric CO2 Concentration Year 2006 atmospheric CO2 concentration: 381 ppm 35% above pre-industrial [CO2] 1850 1870 1890 1910 1930 1950 1970 1990 2010 NOAA 2007; Canadell et al. 2007, PNAS
1850 1870 1890 1910 1930 1950 1970 1990 2010 Anthropogenic C Emissions: Fossil Fuel 2006 Fossil Fuel: 8.4 Pg C [2006-Total Anthrop. Emissions:8.4+1.5 = 9.9 Pg] • 1990 - 1999: 1.3% y-1 • 2000 - 2006: 3.3% y-1 Raupach et al. 2007, PNAS; Canadell et al 2007, PNAS
2006 2005 Trajectory of Global Fossil Fuel Emissions SRES (2000) growth rates in % y -1 for 2000-2010: A1B: 2.42 A1FI: 2.71 A1T: 1.63 A2: 2.13 B1: 1.79 B2: 1.61 Observed 2000-2006 3.3% Raupach et al. 2007, PNAS
Population Wealth = per capita GDP Carbon intensity of GDP Drivers of Anthropogenic Emissions 1.5 1.5 1.5 World 1.4 1.4 1.4 1.3 1.3 1.3 1.2 1.2 1.2 1.1 1.1 1.1 Factor (relative to 1990) 1 1 1 0.9 0.9 0.9 0.8 0.8 0.8 Emissions F (emissions) P (population) 0.7 0.7 0.7 g = G/P 0.6 0.6 0.6 h = F/G 0.5 0.5 0.5 1980 1985 1990 1995 2000 2005 1980 1980 Raupach et al 2007, PNAS
Since 2000: The growth of carbon emissions from fossil fuels has tripled compared to the 1990s and is exceeding the predictions of the highest IPCC emission scenarios Atmospheric CO2 has grown at 1.9 ppm per year (compared to about 1.5 ppm during the previous 30 years) The carbon intensity of the world’s economy has stopped decreasing (after 100 years of doing so). Global Carbon Project conclusions:
Partition of Anthropogenic Carbon Emissions into Sinks [2000-2006] 45% of all CO2 emissions accumulated in the atmosphere Atmosphere The Airborne Fraction The fraction of the annual anthropogenic emissions that remains in the atmosphere 55% were removed by natural sinks Land removes ~ 30% Ocean removes ~ 24% Canadell et al. 2007, PNAS
Land: CO2 fertilization effect, soil respiration, N deposition fertilization, forest regrowth, woody encroachment, … Oceans: CO2 solubility (temperature, salinity), ocean currents, stratification, winds, biological activity, acidification, … Factors that influence CO2 uptake from the atmosphere: Canadell et al. 2007; Gruber et al. 2004
Carbon intensity (KgC/US$) Source Carbon flux (Pg C y-1) CO2 flux (Pg CO2 y-1) Sink Time (y) Perturbation of the Global Carbon Budget (1959-2006) Canadell et al. 2007, PNAS
Source: NCAR 13
Time Dynamics of the Airborne Fraction The observed trend in Airborne Fraction was +0.25% per year (p = 0.89) from 1959-to 2006, implying a decline in the efficiency of natural sinks of 10% Distribution (fraction) 1960 1970 1980 1990 2000 time Canadell et al. 2007, PNAS
The Efficiency of Natural Sinks: Land and Ocean Fractions Land Ocean Canadell et al. 2007, PNAS
Part of the decline is attributed to up to a 30% decrease in the efficiency of the Southern Ocean sink over the last 20 years. This sink removes annually 0.7 Pg of anthropogenic carbon. The decline is attributed to the strengthening of the winds around Antarctica which enhances ventilation of natural carbon-rich deep waters. The strengthening of the winds is attributed to global warming and the ozone hole. Causes of the decrease in efficiency of the ocean sink Credit: N.Metzl, August 2000, oceanographic cruise OISO-5 Le Quéréet al. 2007, Science
Attribution of Recent Acceleration of Atmospheric CO2 • 1970 – 1979: 1.3 ppm y-1 1980 – 1989: 1.6 ppm y1 • 1990 – 1999: 1.5 ppm y-1 • To: • Economic growth • Carbon intensity • Efficiency of natural sinks • 2000 - 2006: 1.9 ppm y-1 65% - Increased activity of the global economy 17% - Deterioration of the carbon intensity of the global economy 18% - Decreased efficiency of natural sinks Canadell et al. 2007, PNAS
“The efficiency of natural sinks has decreased by 10% over the last 50 years (and will continue to do so in the future), implying that the longer we wait to reduce emissions, the larger the cuts needed to stabilize atmospheric CO2.” “All of these changes characterize a carbon cycle that is generating stronger climate forcing and sooner than expected.” Conclusions about the ocean sink from the Global Carbon Project:
What is the role and status of the ocean as a carbon sink? How is increased CO2 affecting the ocean and its ecosystems?
CO2 + H2O H2CO3 H2CO3 can dissociate to Bicarbonate HCO3- Carbonate CO3-2 At normal ocean pH, 90% of the carbon is in bicarbonate, 9% is in carbonate, 1% is in CO2
Scientific American 2006, Doney, The Dangers of Ocean Acidification 23
Organisms that create skeletal material out of CaCO3 require high CO3 concentrations in seawater to precipitate the CaCO3 CaCO3 can be in the crystal form of aragonite or calcite - aragonite is much more soluble
Corals Also aragonite, the most soluble form for CaCO3
Calcification of coral is projected to decrease by 10-30% under doubled CO2 concentrations (Gattuso et al, 1999; Kleypas et al, 1999) This is supported by laboratory studies under doubled CO2 atmosphere (Langdon et al, 2000)
Several times in the past had higher atmospheric CO2 concentrations without impacts on calcifiers, however The high rate of CO2 increase has led to an out of equilibrium condition that is reflected in the decreasing pH
Global change impacts physical processes that can lead to feedback reducing the effectiveness of the oceanic carbon sink But they are, so far, affecting the physical solubility of CO2, not its uptake by biological processes that transport CO2 to deep water The increasing CO2 has impacts, however,especially on calcifying organisms
Even if we eliminate CO2 emissions now, we will observe impacts on calcification from the current atmospheric CO2 concentrations The only way to avoid this is direct removal of CO2 from the atmosphere This will be one of the most difficult problems to tackle