Download
1 / 23
230 likes | 535 Vues
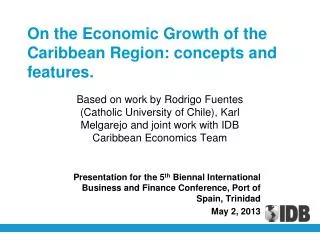
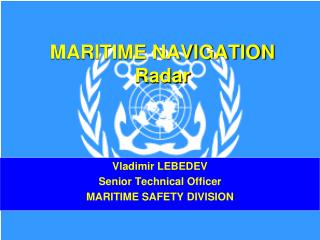
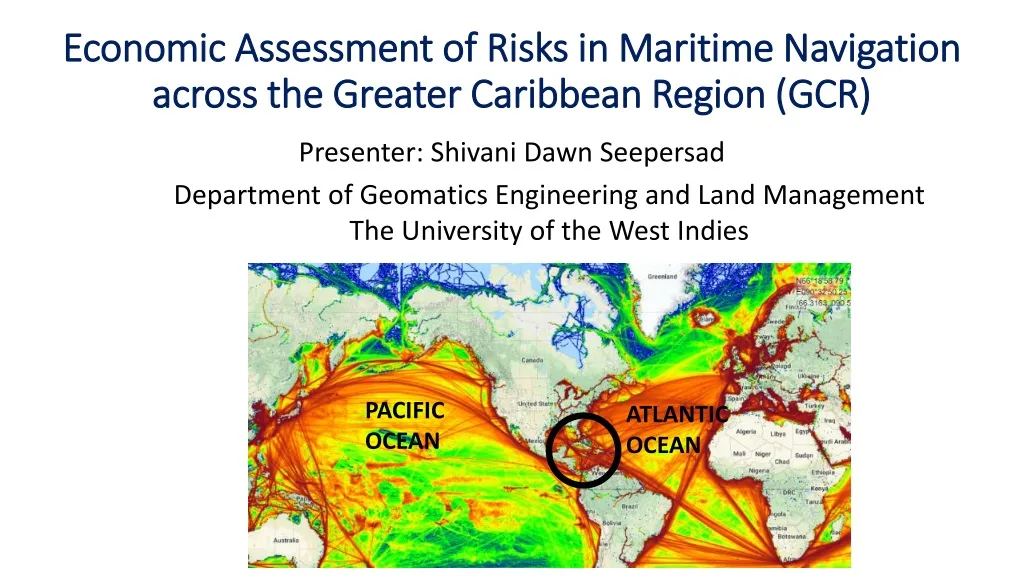
Economic Assessment of Risks in Maritime Navigation across the Greater Caribbean Region (GCR). Department of Geomatics Engineering and Land Management The University of the West Indies. Presenter: Shivani Dawn Seepersad. PACIFIC OCEAN. ATLANTIC OCEAN. Introduction to this Study.

E N D
Economic Assessment of Risks in Maritime Navigation across the Greater Caribbean Region (GCR) Department of Geomatics Engineering and Land Management The University of the West Indies Presenter: Shivani Dawn Seepersad PACIFIC OCEAN ATLANTIC OCEAN
Introduction to this Study • Maritime navigation is important to the Greater Caribbean Region (GCR) because it facilitates economic expansion. • However, the environment, economy and culture of the region are at risk of unwanted events which can have short or long term consequences. • This study therefore involves an economic assessment of risk in maritime navigation across the GCR.
Structure of the Presentation • Introduction • Significance • Strategies tested • Preliminary results • Method being formulated • Conclusion & ongoing research
History of Maritime Accidents across the GCR The World’s largest ship based oil spill took place within Trinidad & Tobago’s EEZ !! Fifty eight accidents were reported across the GCR over the last 16 years including: • 8 collisions • 10 fires or explosions • 5 foundered • 4 mechanical damage • 3 mechanical & technical failure • 10 groundings
Significance of the Study The results will contribute to the monitoring and management of maritime navigation by supporting the: • Prioritization of resources • Reduction of risk • Improved security of the marine environment • Expansion of international trade opportunities
Aim and Objectives Aim: To conduct an economic assessment of risks in maritime navigation across the Greater Caribbean Region (GCR) Objectives: • Formulate a risk assessment strategy • Generate an economic model to estimate losses associated with maritime accidents Caribbean Sea Source: Marine Traffic Marine traffic density across the GCR
Commonly Used Strategies for Conducting Risk Assessments Strategies for risk assessment were developed by maritime departments including: • IALA Waterway Risk Assessment Programme (IWRAP) • Land Information New Zealand (LINZ) • Canadian Hydrographic Service • Arctic Region Hydrographic Commission • National Oceanic and Atmospheric Administration IALA considers traffic flow while the others used traffic density.
General Outline of the Hydrographic Risk Assessment Strategy developed by Land Information New Zealand (LINZ) • Applies data from satellite or terrestrial automatic identification systems. • Applies a weighted modelling approach – • The scores are acquired from expert judgement. 3. Represents the relative level of risk on a heatmap.
Results of the Hydrographic Risk Assessment developed by Land Information New Zealand There is risk in maritime navigation across the GOP. Projection: WGS 84 Zone 20 N Under the LINZ strategy, no units are associated with the risk value.
General Outline of the Strategy Developed by the IALA Waterway Risk Assessment Programme (IWRAP) IWRAP calculates the probability of grounding, allision or collision based on: • The average number of potential accidents (near misses), assuming that no evasive action is taken (blind navigation). • Then adjusts this number by multiplying it with the probability that an evasive action fails.
Collisions are expected to occur every 149 years Powered grounding is likely to occur every 24 years Traffic density Drifting grounding is likely to occur every 345 years Results of the Strategy Developed by the IALA Waterway Risk Assessment Programme (IWRAP) Port of Spain Port of Spain Port of Spain Point Lisas • The approach channels to Port of Spain and Point Lisas are at risk in maritime navigation • There is pilotage in these areas Point Lisas Point Lisas Point Lisas
Major Limitations of LINZ Risk Model Major Limitations of IWRAP Risk Model Likelihood of accidents: • Does not model dynamic vessel characteristics for e.g.: rate of change of speed or course • Does not use satellite AIS data Consequences of accidents: • Does not model consequences of accidents Risk Value: • Does not include a measure of consequences Limits on how much data can be processed. Likelihood of accidents: • Does not model dynamic vessel characteristics for e.g.: direction of transit, rate of change of speed and course • Based on subjective weights Consequences of accidents: • Does not measure consequences as an economic loss per year Risk Value: • Provides a relative risk value with no units This method is also time consuming.
Economic Assessment of Risks in Maritime Navigation Area of study: Greater Caribbean Region Main datasets being applied: Vessel position and characteristics from satellite and terrestrial automatic identification systems Information represented on nautical charts for e.g.: bathymetry and the location of wrecks Risk Value = Likelihood x Consequence Software: Python programming, ArcGIS Pro Source: Marine Traffic
Strategy to Estimate the Likelihood of Groundings and Collisions across the GCR • 1. Calculate the likelihood of grounding, per unit area: • Model ship domains based on vessels’ characteristics and seabed characteristics • Assess near misses between ship domain and the seabed • 2. Calculate likelihood of collision, per unit area: • Dynamic ship domains based on: likely environmental conditions and vessels’ characteristics for eg: rate of change of speed and course of vessel • Assess frequency of near misses between ships’ domains and between domains and obstructions Ship Domain - 3D operational zone around the ship which should not be encroached SHIP SEAFLOOR
Strategy to Estimate the Likelihood of Groundings or Collisions across the GCR 3. Categorize the likelihood values as measures of incidents per year The likelihood of grounding and collision are summed per unit area and quantile data distribution is applied to categorize the likelihood values using a five point scale.
Strategy to Estimate the Economic Consequences of Groundings and Collisions per year, across the GCR 1. Estimate the value of sensitive coastal resources based on the following techniques: • Market valuation - the value of an asset based on the price that would be paid for it, if it were sold at a certain time. • Non-market valuation – how much people would be willing to pay to protect the resource
Example of Results from the Strategy to Estimate the Financial Consequences of Groundings and Collisions per year, across the GCR • Residents of Trinidad and Tobago are willing to pay US$ 1,234 / ha / year to protect the Caroni Swamp • Caroni Swamp valued at US$ 10 mn / year Caroni Swamp valued at $10mn USD per year Department of Agricultural Economics and Extension, The University of the West Indies
Strategy to Estimate the Financial Consequences of Groundings and Collisions per year, across the GCR 2. Assign a consequence score (in economic losses per year), using a five point scale: • Create buffers around coastal resources where potential accidents may have a negative impact. • Assign a consequence score per unit area using a five point scale.
Assigning a Score for Consequences Per Unit Area Source: IALA
Calculating the ‘Risk Value’ Risk Value = Likelihood (Probability) score x Consequence score For example: x insignificant probability (2) severe consequence (3) = risk value of 6
Moderate Risk Reduce to As Low As Reasonably Practicable (ALARP) level using Risk Control Options. Source: IALA
Ongoing Immediate Objectives • Develop a robust and repeatable script using Python and ArcGIS Pro to: • Calculate the likelihood of grounding and collision then categorize the values in incidents per year using a five point scale. • Create buffers around coastal resources where potential accidents may have a negative impact. Next, assign a consequence score in economic losses per year based on market and non-market valuation techniques to estimate the value of the coastal resources • Calculate the final risk value per unit area.
Data Required from Nautical Charts in a GIS Format across the Greater Caribbean Region • Age & Quality of nautical charts • Bathymetry • Coastline • Maritime boundaries • Obstructions on the seafloor • Ports • Aids to navigation • Protected areas • Tide and current • Fisheries • Offshore and coastal installations • Designated areas (for example spoil grounds & oil wells) • Underwater cables • Recreational areas Area of Study – Greater Caribbean Region